Photo by Enayet Raheem on Unsplash.
Post updated February 2022.
When can you get your hands on 2020 Census data?
It’s complicated. Here’s a table with important dates.
| Date | Data Type | Description |
| February 2021 | Geography data | The boundaries (think outlines) |
| April 30, 2021 | Apportionment count | Population by state |
| Aug 16 & Sep 30 2021 | Redistricting count | Limited demographics by state. Aug = legacy format; Sept = “easy to use” format. |
| May & Aug 2023, TBD (details) | Demographic & Housing Characteristics File AND Detailed File | **The GOOD stuff** Staggered release by state for all demographics for small geographies. |
| March 17, 2022 (details) | American Community Survey 5 year estimates | Not 2020 Census but has important data that’s not in the 2020 Census like income |
The Long Answer (that only my mom will read)
February 2021 – Spatial data
The US Census Bureau has already released the 2020 geographies, and we’re still waiting on the demographics. It’s like getting the tender, flaky cannoli shells first and then having to wait for the creamy ricotta filling.

2020 Census geographies are like cannoli shells in that they are not nearly as exciting without the demographic data filling!
April 30, 2021 – Apportionment count
We’ve received state level resident population (+ the overseas federal employees) in this data release which is used for determining seats in Congress. Here’s a new blog post all about the apportionment data called Population Growth by State 2020.
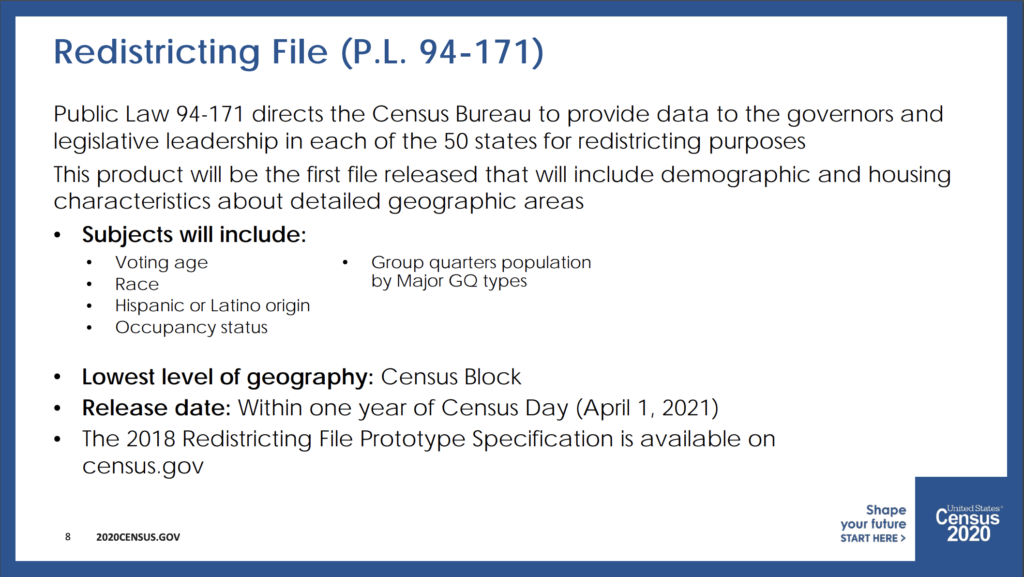
August 16 & September 30, 2021 – Redistricting data
This data release will be the first file that includes demographic and housing characteristics. The good news is that the redistricting dataset will be available for small geographies like Census blocks. The bad news is that this dataset will only include:
- Population
- Voting age
- Race & ethnicity
- Housing units & occupancy status
- Group quarters << don’t worry if you don’t know what this is
Update: August 2021
Here’s how you get your hands on the 2020 Redistricting data.
If you’re skilled in working with large datasets…
- You can access the data directly from the Census Bureau here. It’s in a legacy format (aka hard to work with), but an easier-to-work-with version is coming in September.
If you need State by State visualizations…
- You can explore the data for your state here.
If you need 2020 Redistricting data for cities and counties and don’t want to DIY…
- You can purchase a Demographics by Report that includes the new 2020 data. Details.
If you need 2020 Redistricting data for radiuses around a location…
- Your radius reports now include a tab in the Excel file with the 2020 Redistricting data so you can compare it to the 2019 American Community Survey data. Details.
If you need data for zips/ZCTAs…
- There are no 2020 Census redistricting data for zips/ZCTAs now. It will be released later, but the Census Bureau hasn’t said when yet. We could use the small Census geographies to create 2020 estimates for zips/ZCTAs if we hear from enough of our clients that this would be helpful. Or we could just wait until the Census Bureau releases the official data for zips/ZCTAs. Contact me if you have a preference.
If you need 2020 Redistricting data and don’t fit into any of the above categories …
- You can get 2020 Redistricting data as a custom data pull. Let me know what you need here and I’ll provide you with a quote and turnaround time. I do love weird data requests, so send me something good!
May 2023 – Demographic Profile
This new dataset will include demographic & housing data for cities only (technically: places/minor civil divisions — but will it be all cities or just big cities?) and is supposed to be released “as soon after the release of the Redistricting product as possible.”
May 2023 – Demographic and Housing Characteristics File (DHC) & Detailed Demographic Housing Characteristics File
This is the dataset that you and I and everyone who isn’t doing redistricting really wants — the luscious filling for our cannoli – with all of the available 2020 Census demographics for large & small geographies.

Yes! I want the geography data cannoli shells stuffed full of the demographic data filling.
Rumor has it that this dataset will be released on a state by state basis and won’t be fully available until December 2021. The Detailed Demographic and Housing Characteristics File will be released in 3 separate data products:
- Detailed DHC-A – planned release August 2023
- Detailed DHC-B – release TBD
- Supplemental-DHC (S-DHC) – release TBD
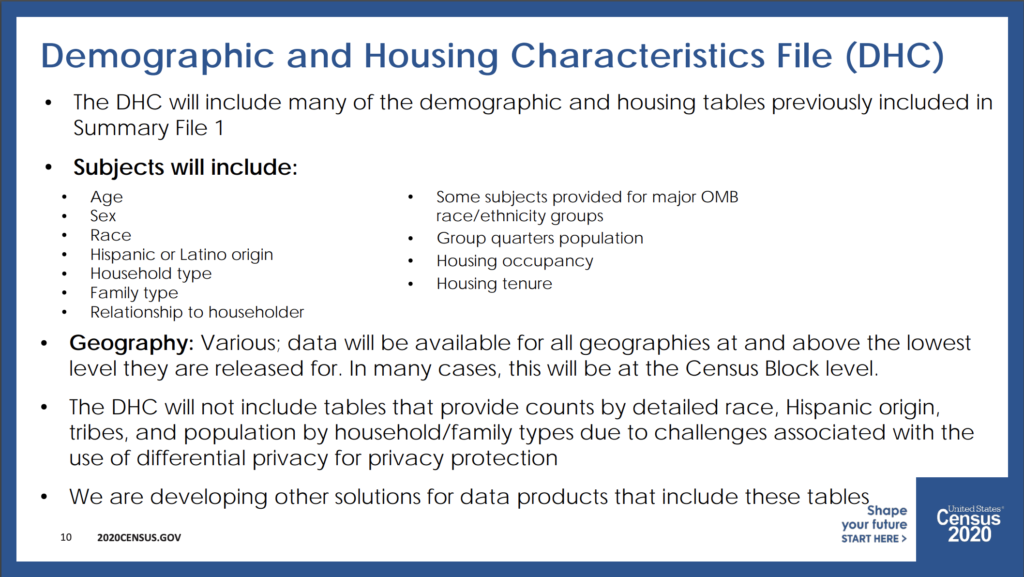
Data nerd aside: The DHC will include many of the demographic and housing tables previously included in the Summary Files. DHC subjects include:
- Population:
- Age
- Sex
- Race & ethnicity
- Household & family type & relationship
- Housing Units
- Occupancy status (occupied vs vacant)
- Tenure (owner vs renter)
But don’t forget that we’ll still have to use the American Community Survey for important data like income.
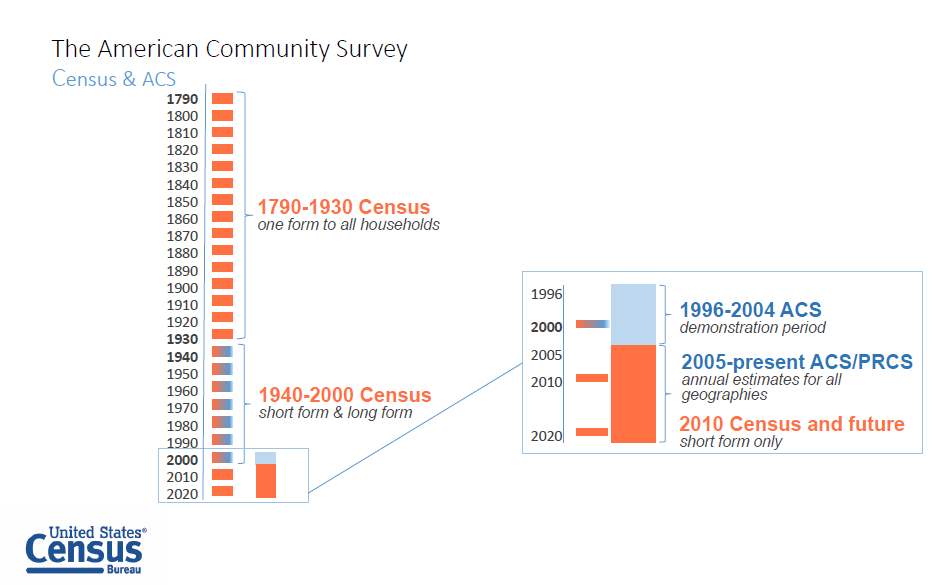
March 17, 2022 – American Community Survey 2020 5 Year Estimates
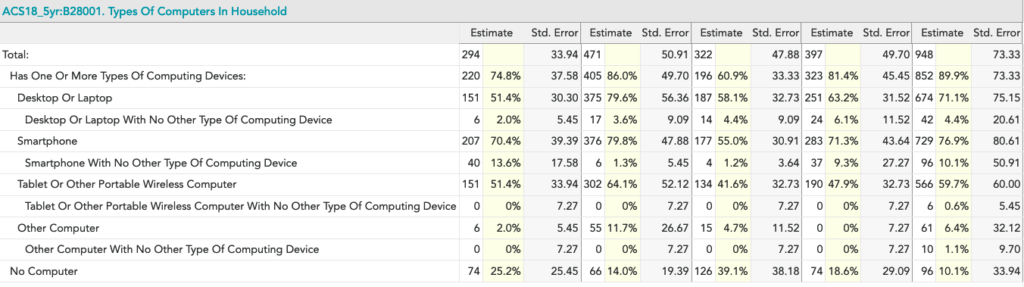
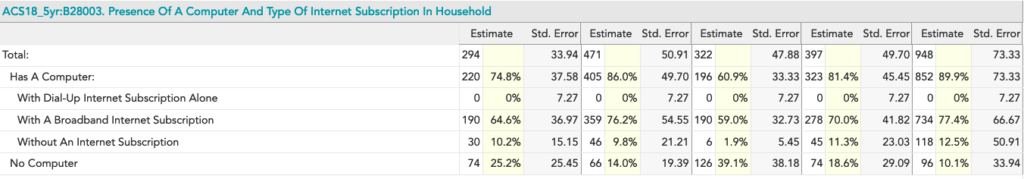
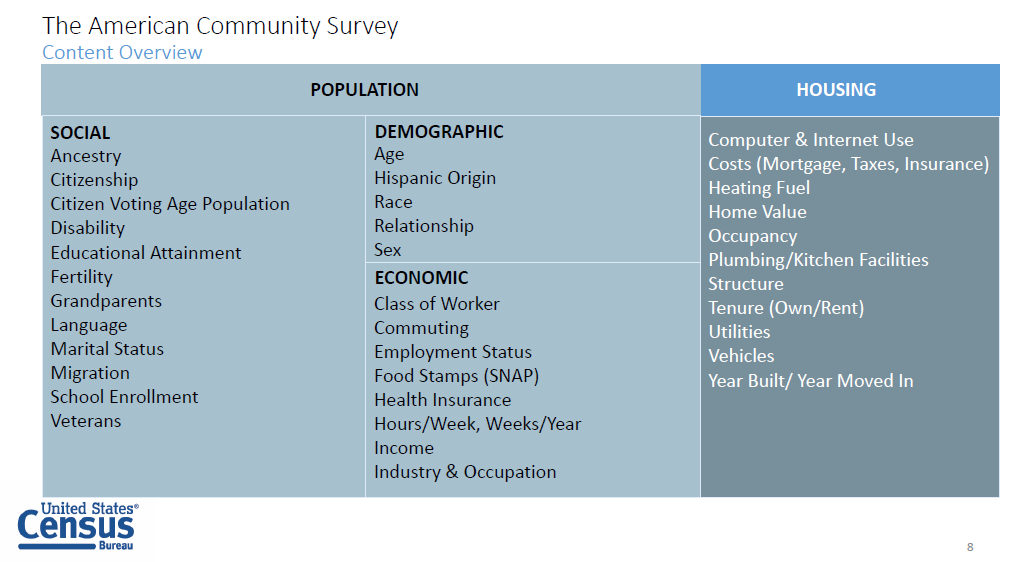
The American Community Survey (ACS) is the ongoing, annual survey of 3.5 milllion addresses that collects the social, economic, housing, and demographic characteristics of the nation’s population. The US Census Bureau will use ACS surveys collected in 2016, 2017, 2018, 2019 and 2020 to produce demographic estimates for small geographies like zip codes/ZCTAs for 2020. Historically, the ACS is released in December.
Update March 2021. The Census Bureau has communicated that the 2020 American Community Survey (ACS) will use the 2010 ZCTA boundaries rather than the 2020 ZCTA boundaries. As of right now, whenever the 2020 Census demographics are released for zips/ZCTAs, there won’t be 2020 income data for those same zips/ZCTAs. The Census Bureau is planning on using the updated 2020 ZCTA boundaries in the 2021 ACS release.
Update February 2022. The Census Bureau has communicated that the 2020 American Community Survey will be released on March 17, 2022 (details).
But I’m curious to learn if the 2020 ACS (to be released in 2021) or the 2021 ACS (to be released in 2022) will use the same geographies as the 2020 Census. I asked the Census Bureau this question and their reply is below:
“The 2020 ACS Data Release schedule will be posted within the next week or two. We are planning on updating the Geography Boundaries by Year page at the same time, which will tell you which boundaries will be used for each level of geography in the 2020 ACS data products. This geography boundaries by year page is usually posted at the same time as the data release in September, but we are posting it early this year because we have gotten a lot of questions about which boundaries will be used due to the 2020 Census.”
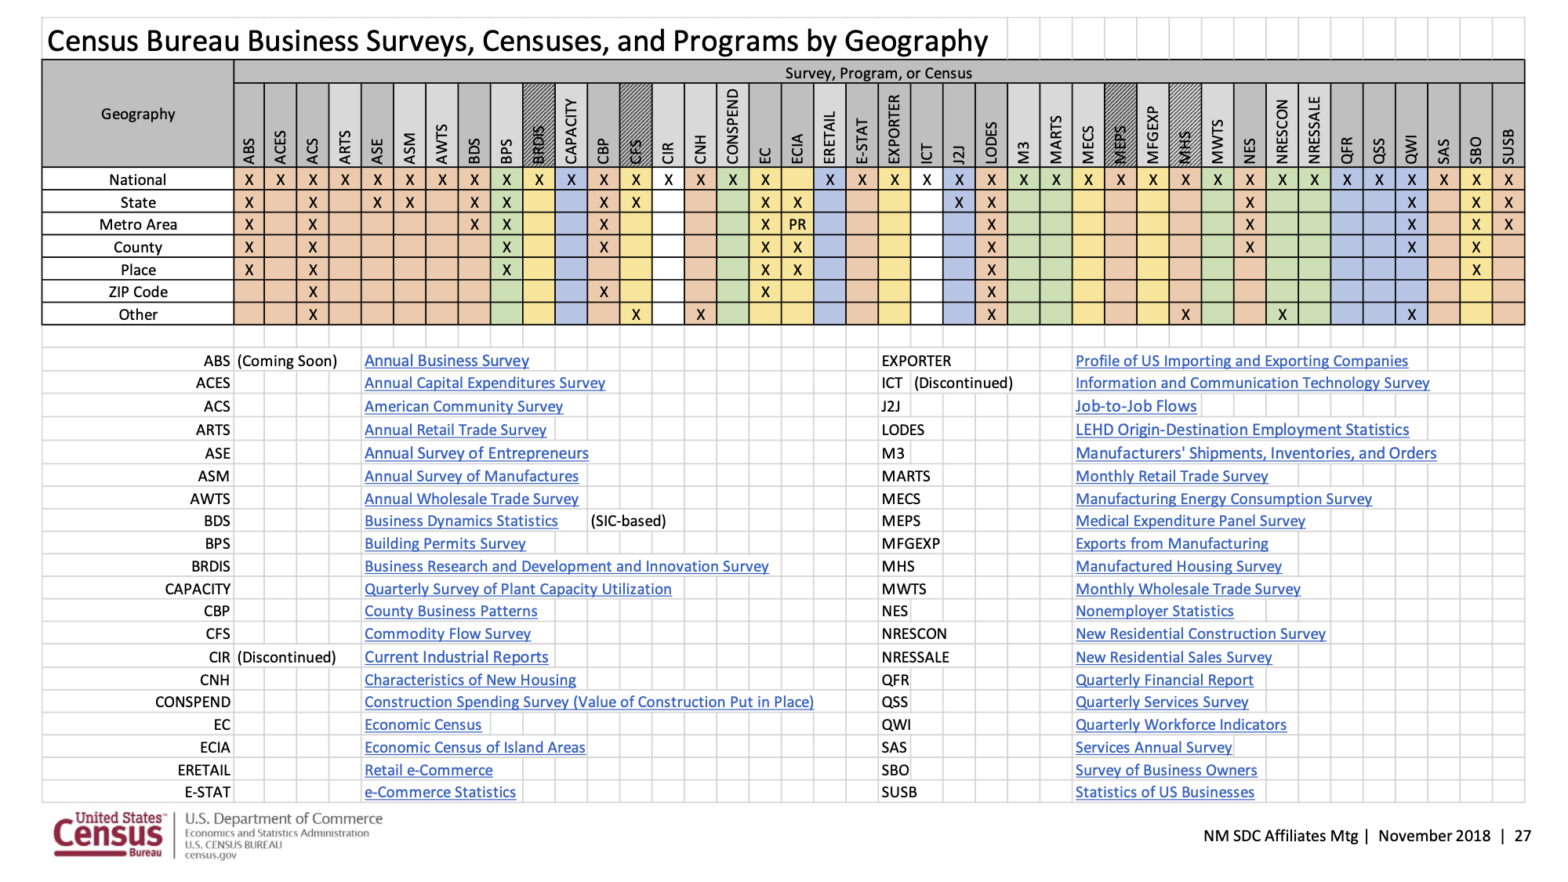
Below are some lovely graphics explaining how the ACS and the Decennial Census fit together and are different.
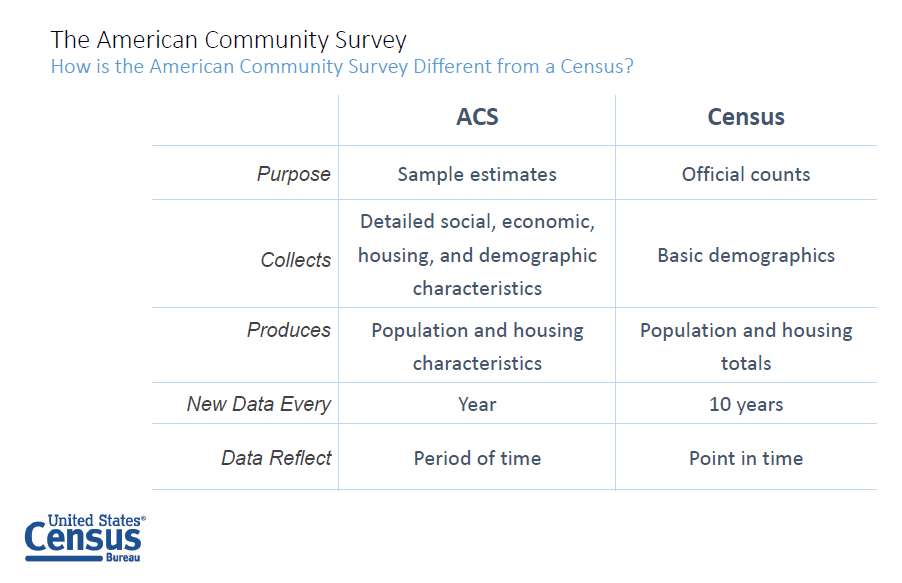
Now if you’ll excuse me, I’m hungry for cannoli – I can’t imagine why. Send me an email if you have any more burning questions about the 2020 Census, and I’ll reply after my cannoli run.