10 of the Best US Crime Data Resources
Planning Data
Kristen Carney

Photo by Bill Oxford on Unsplash
”Happy families are all alike; every unhappy family is unhappy in its own way.” ― Leo Tolstoy, Anna Karenina
Not only are crime data about an unhappy topic, I also feel like each source of crime data that we pull for clients has a major drawback or “is unhappy in its own way.” While crime data is a bit outside of my area of expertise (which is demographics & business data), I do occasionally pull crime statistics for clients. Below is an overview of who uses crime data and why as well as 10 resources along with each source's unhappy limitation.
Most Popular Uses of Crime Data
- Businesses building models. Our business clients who are interested in crime data tend to be building models, and crime data is just one of many different types of data that they want to use in their models. For example, a prospect was interested in “associating medical trends with risk data to potentially identify problem areas sooner and determine where what type of resources are needed most based on risk and their associated medical needs. For instance, we may want to create a burn victims unit in areas with higher fire risk vs those with low fire risk, or staff more mental health professionals in higher crime.”
- Non-Profits. We also pull crime statistics for non-profit clients who need this information for their community needs assessments or when writing grants.
- Real Estate Developers. Crime data are important to developers who need to show that they are building in a low crime neighborhood so they can get their affordable housing developments approved by government agencies. Crime statistics can be central to approval and is often subject to dispute if the data shows crime is too high.
| Data | Source | Price | Small Geographies Available? |
| Crime Counts | FBI UCR/NIBRS | Free | Law Enforcement Agencies |
| NCVS | Free | No. Entire US | |
| OJJDP | Free | No. States & US | |
| Crime Risk | Applied Geographic Solutions | $$$ | Blocks groups, Census tracts, Zip Codes & more |
| Neighborhood Scout | $ Subscription | Neighborhoods | |
| Crime Maps | CityProtect | Free | Map of Incidents |
| SpotCrime | Free | Map of Incidents | |
| LexisNexis Community Crime Map | Free | Map of Incidents | |
| Custom Data Pull | Cubit | $ | We pull the best geography for your project. |
CRIME COUNTS
FBI Uniform Crime Reporting Program/National Incident-Based Reporting System
Link: https://www.fbi.gov/services/cjis/ucr
Price: Free
If you need crime counts by type of crime for cities or counties and you aren’t worried about geographic differences, then the FBI crime datasets are the right fit. Data are provided by law enforcement agencies rather than standard geographies like a zip code. We most often pull FBI crime data for the geographies of County Agencies and City Agencies. There are also data for Metropolitan Statistical Areas or MSAs, but these geographies tend to be too large for the types of projects that we pull data for. There are also data provided for Universities and Colleges as well as State, Tribal and Other Agencies, but honestly, most of our clients just ignore these agencies and just get city and county data.
There are 2 drawbacks to this dataset:
- Crimes are reported by agency rather than rolled up to a geography. To quote Neighborhood Scout “…crimes are reported by individual law enforcement agencies, rather than by city or town, and many cities – even small ones – have more than one agency responsible for law enforcement (municipal, university, county, transit, etc.). Even FBI data are reported by agency not by city or town, providing an incomplete assessment of city-wide crime counts. It is an agency-centric rather than locality-centric reporting method. If you use FBI data, you only get city-wide general counts, and only from one agency in the city, so it is generally incomplete for the city overall, as well as not specific to a neighborhood or address.”
- There are no FIPS or unique geography ids that make it easy to join this dataset to other datasets like Census data. You have to do name joins which are error prone and painful.
An Example of Data Collected by the FBI for the Uniform Crime Reporting Program
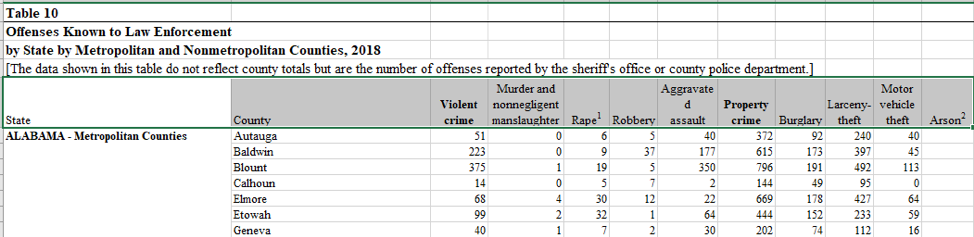
The UCR also provides additional details about the persons arrested, such as age, race and ethnicity, the weapons used and the value of items stolen.
The FBI uses a tool called the Crime Data Explorer in an effort to make crime data more user friendly. The Crime Data Explorer currently includes violent crime statistics (murder and nonnegligent manslaughter, rape, robbery, and aggravated assault) and property crime (burglary, larceny-theft, motor vehicle theft and arson)
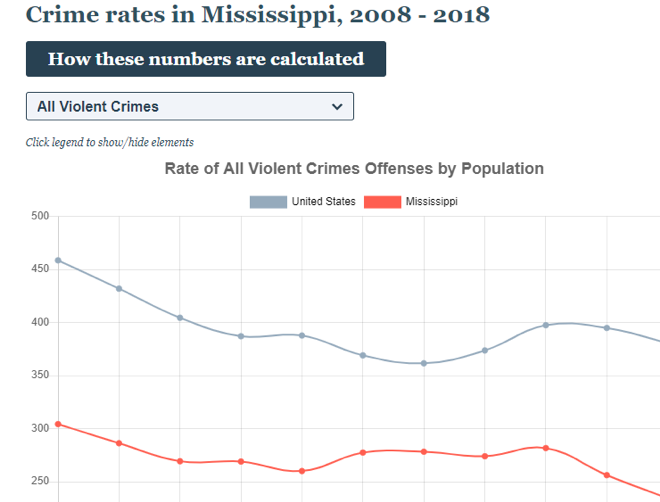
Crime Data Explorer
State crime rates can be compared to national crime rates.
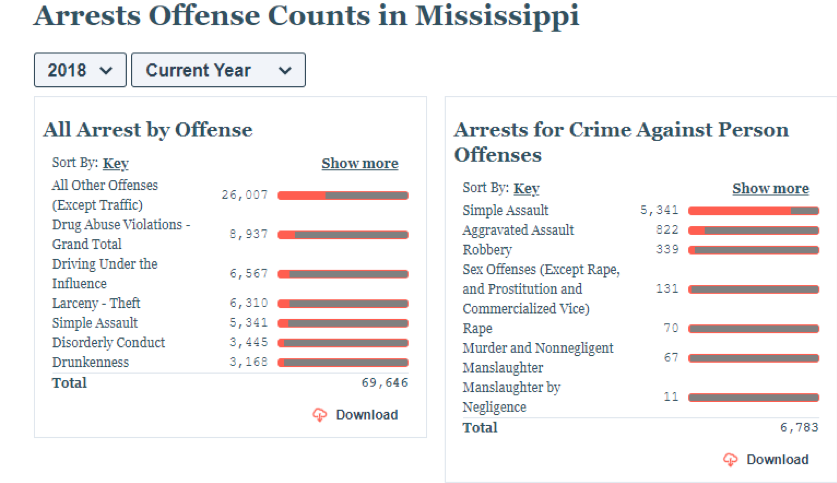
This is an example of the Arrest Data found in the Crime Data Explorer tool.
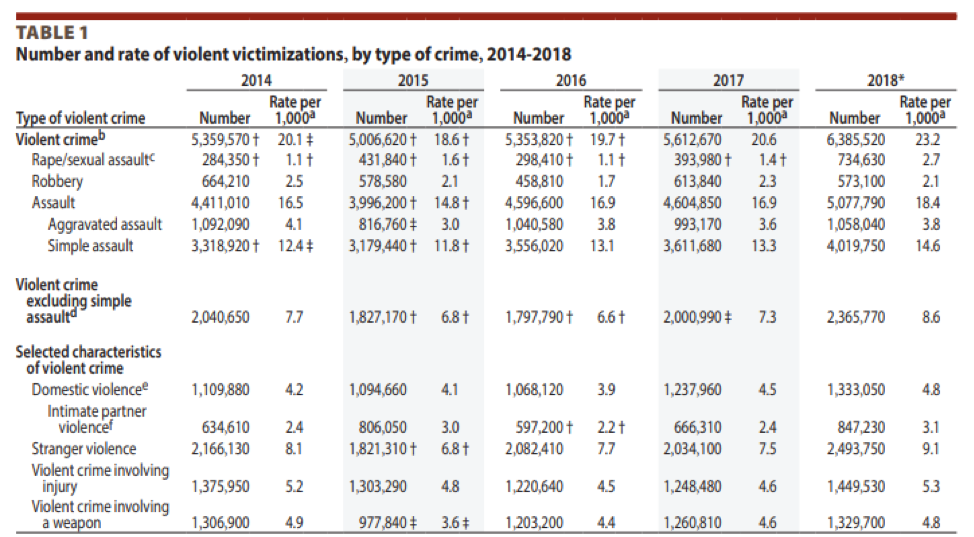
National Crime Victimization Survey (NCVS)
Link: https://www.bjs.gov/index.cfm?ty=dcdetail&iid=245
Price: Free
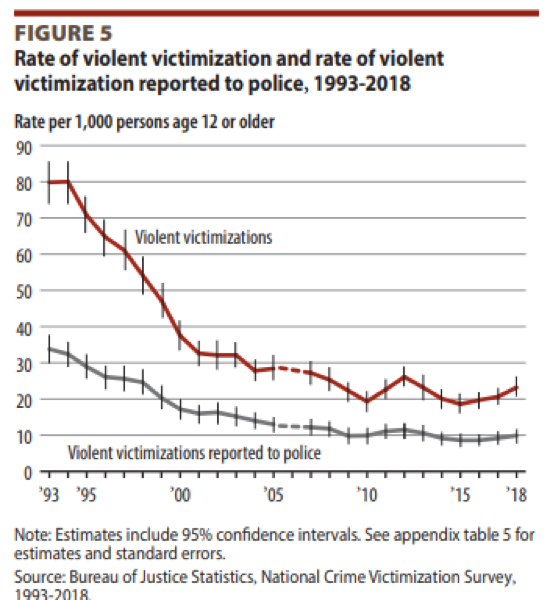
The NCVS is an annual data collection conducted by the U.S. Census Bureau. The purpose of the NCVS is to fill in the gaps between crimes reported to law enforcement and those that are not. The collection reports national statistics only and doesn’t provide data for smaller geographies. Data includes nonfatal personal crimes (rape or sexual assault, robbery, aggravated and simple assault and personal larceny) and houseold property crimes (burglary/trespassing, motor-vehicle theft, and other theft).
Here is an example of the difference in crimes reported to the police and those that aren’t. The table below provides the crime rates for different types of crimes.
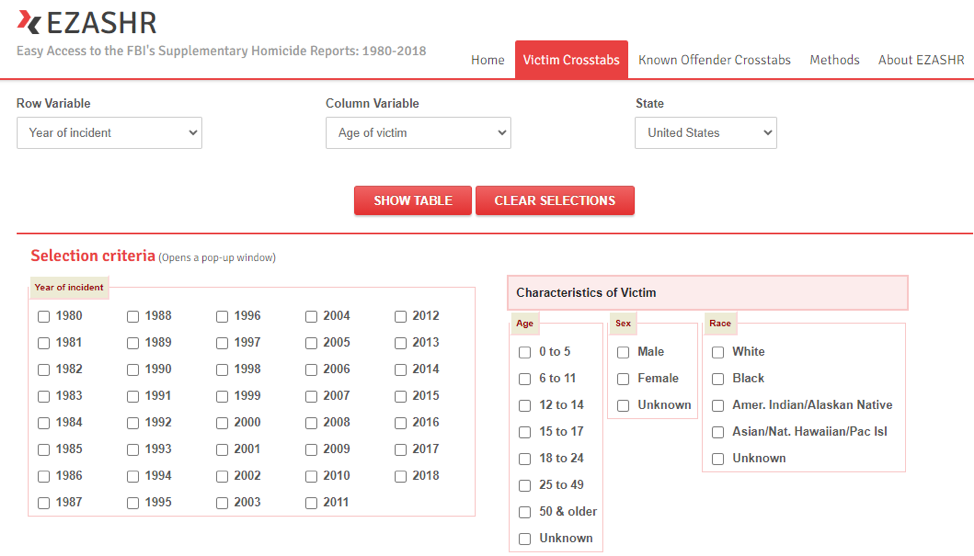
Office of Juvenile Justice and Delinquency Prevention (OJJDP)
Link: https://ojjdp.ojp.gov/research-and-statistics
Price: Free
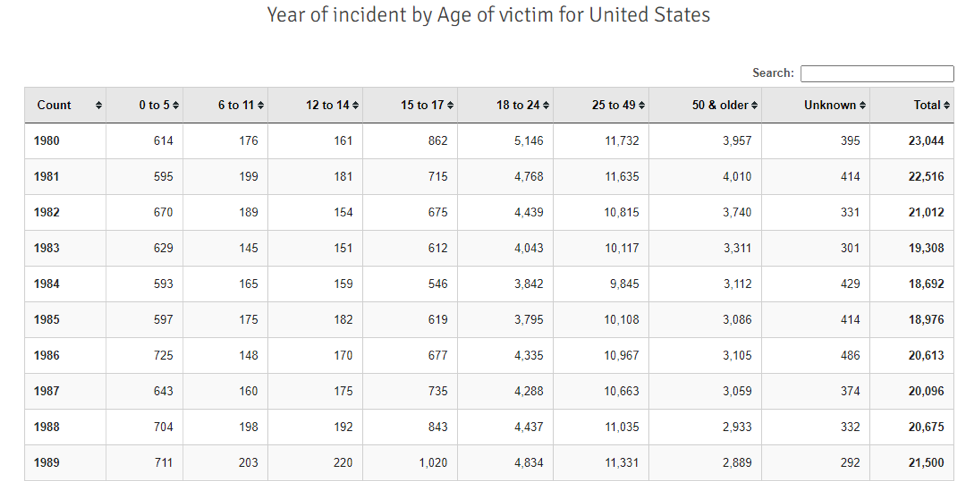
Juvenile offenses, as well as crimes where juveniles are victims are included in the OJJDP’s crime report for each US state. The Statistical Briefing Book is a tool that provides access to online information about juvenile crime and victimization and about youth involved in the juvenile justice system.
Below is an example of the options provided to search for juvenile crime statistics, as well as an example of the data returned.
CRIME RISK
Applied Geographic Solutions (AGS)
Link: You can buy this data through us since we are a vendor.
Price: Base Price: $3,750 for all US zips; $1,250 for all US counties *
If you are doing model building and need crime data for small geographies like zip codes, the Applied Geographic Solution dataset with crime indexes can be a helpful resource. Using advanced analysis of a rolling seven-year database of FBI and local agency statistics, AGS provides relative crime risk, not just crime occurrence. Crime risk is an index of the probability of crime in a geographical region compared to the entire US. Zip code is the most popular geography that's requested, but county and city data as well as smaller geographies are available as well. FIPS codes are also provided with the data, which makes it easy to connect geographies between datasets – super important for doing modeling work when you need data from multiple sources.
The AGS crime data comes from a private data vendor rather than a public agency. Unlike the FBI data above, there will be restrictions on how you use the data. The prices above are rough quotes, and I’ll have to adjust the pricing based on number of users and how you are using the data (e.g. internal modeling versus publishing online). Contact me if you are interested in continuing the conversation here.
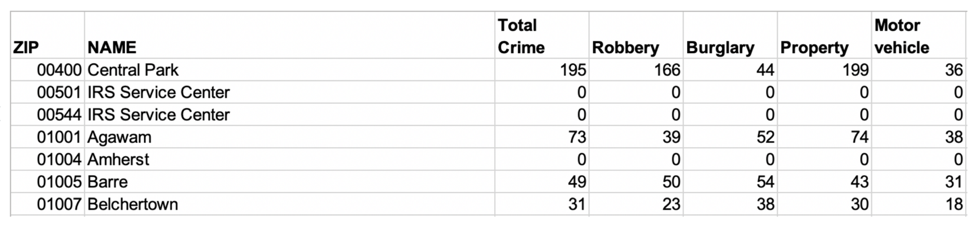
Below is an example of the type of information that AGS provides:
Neighborhood Scout
Link: https://www.neighborhoodscout.com
Price: $39.99 - $119.99/month for a subscription report reports
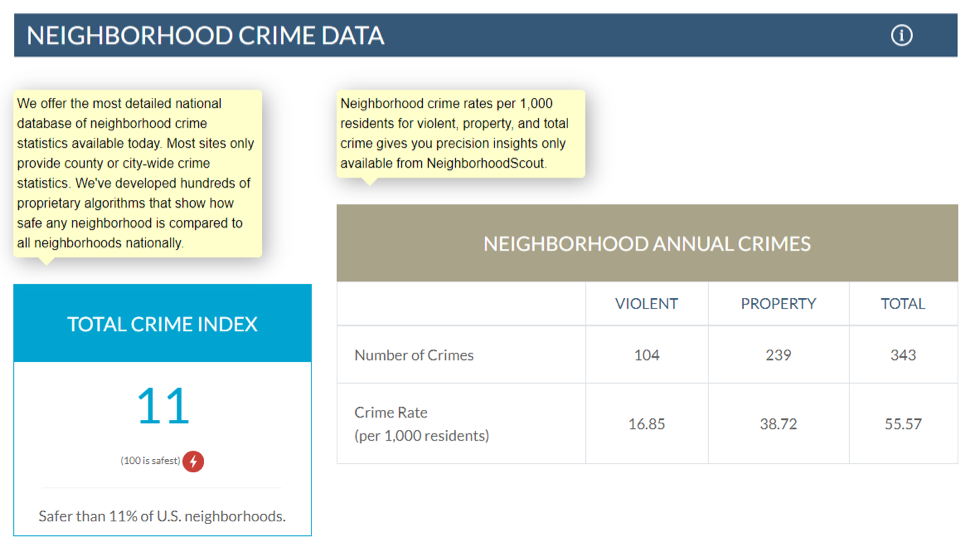
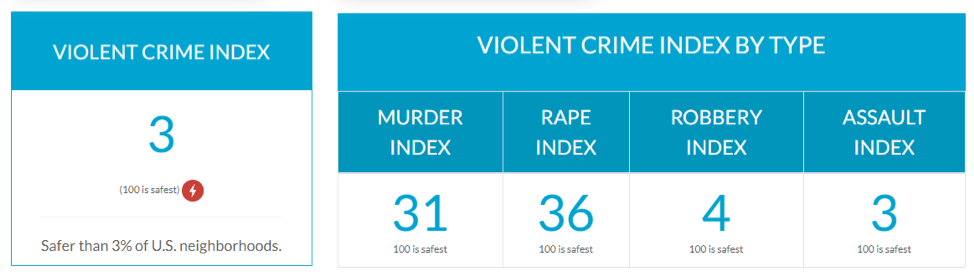
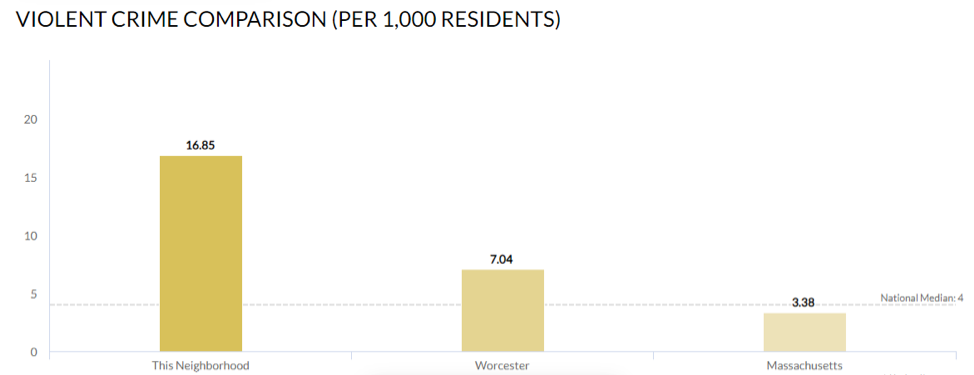
Neighborhood Scout is geared toward real estate investors who want to identify opportunities with low crime risk. Other free web sites collect data from local law enforcement agencies, not by locality, which tends to leave holes in the data. Not all agencies elect to report data and some localities have more than one agency. Neighborhood Scout fills in the holes by using like neighborhood crime data leading to seamless 100% US coverage.
By entering an address, an investor can get a full report on the crime risk of a neighborhood. The report includes crime risk ratings for several crime types, a resident’s risk of becoming a victim and 5-year trends and forecasts.
Below is an example of the type of information that Neighborhood Scout provides:
CRIME MAPS
Links:
LexisNexis Community Crime Map
Price: Free
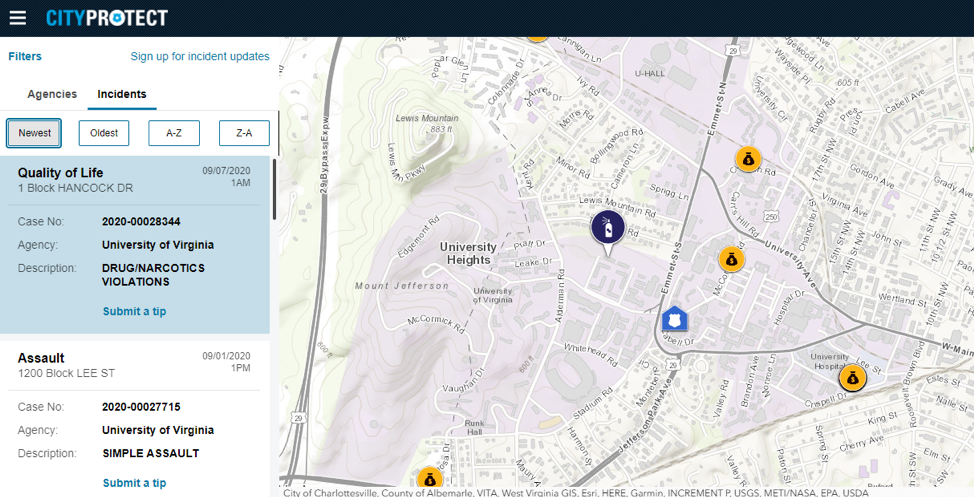
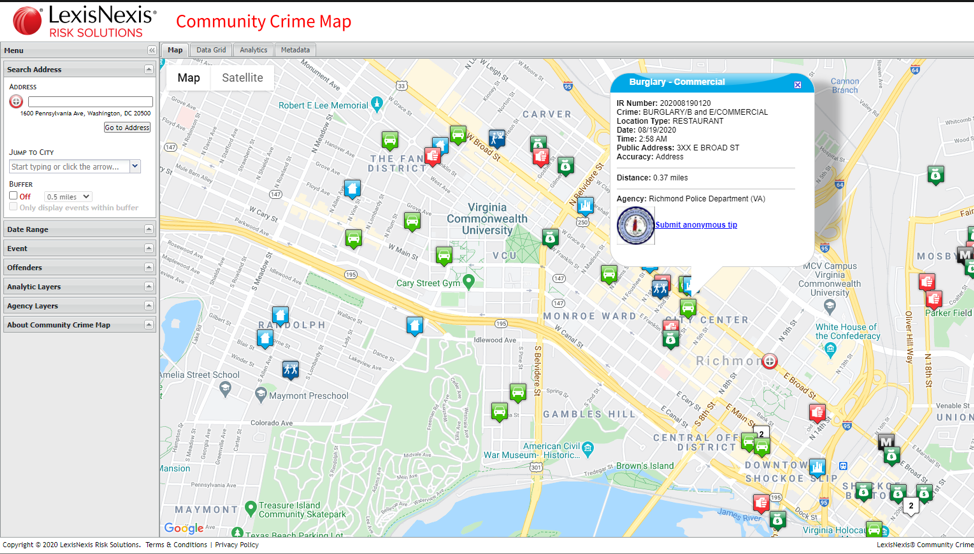
City Protect, Spot Crime and LexisNexis Community Crime Map all provide interactive maps of crime data from law enforcement agencies. You can search for an address and get a map of where or what neighborhoods have the most crimes and what types of crimes were committed in the past. If you are getting a radius report, you might want to also check one of these map solutions for recent crimes in your area of interest. By doing a simple search on zip code, city, or state, you have the ability to see incident details, statistics and reports. Like the FBI UCR, the data available is dependent on reports provided by law enforcement agencies. Some areas may not have any crime information available due to lack of participation by the local agency.
Here’s what these resources look like.
City Protect
Spot Crime In addition to an interactive map, SpotCrime also has a Trend tab with a summary of crime trends.
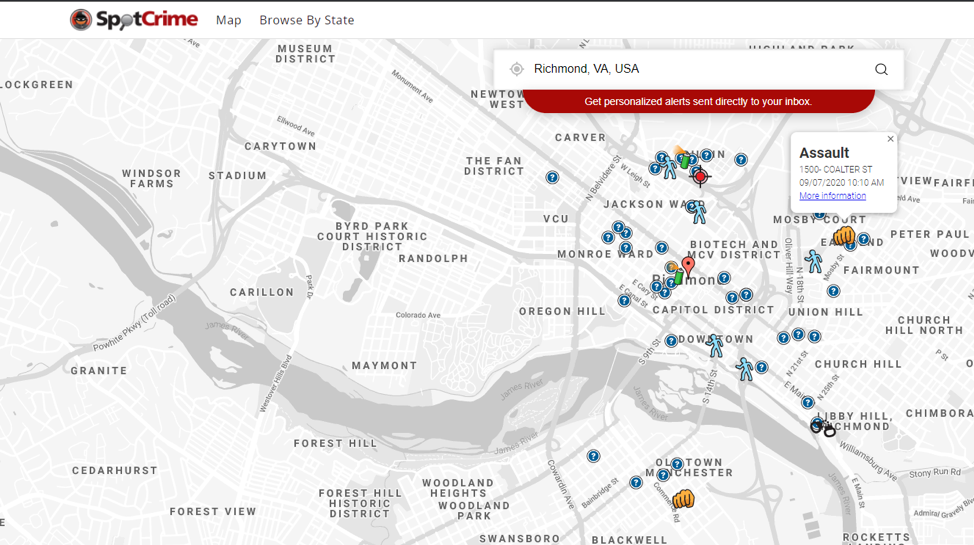
LexisNexis Community Crime Map lets you filter date and type of incidence. It also has option for to buffer addresses.
CUSTOM DATA PULL
Cubit
Price: Starting at $599 and depends on geographies and years needed.
Geographies: All US geographies from large geographies like states and counties to small geographies like zips, census tracts and blocks.
Whew! Still reading? I’m impressed. So if you’ve gotten this far and you’re thinking, “Yeah, sure I could pull all of this data myself in a couple of days, but I have other important things to do and I really don’t want to sift through all of the data dictionaries, methodology statements and tool instructions to make sure that I have the most current data,” you are not alone. You sound just like our other clients at Cubit who depend on us to provide clean, accurate and easy-to-work-with data as well as human-to-human customer support. Prices start at $599 with a 3 business day turnaround. Tell me what data you need for what geography & I’ll get you a free quote & turnaround estimate.