Building Broadband Maps with Census and FCC Data
Planning Data
Kristen Carney
Photo by Mika Baumeister on Unsplash
The outbreak of Covid-19 has shifted more of the world online. Kids are going to school from home and need internet access for their classes. Staff are working remotely and meeting online. Coincidentally, interest in data about broadband availability and home computers has increased as government agencies, businesses and non-profits are identifying areas that lack fast internet.
There are 2 government datasets that I use to help our clients identify areas lacking broadband internet:
- US Census American Community Survey
- FCC’s Fixed Broadband Deployment Data
Many state and local governments use these datasets to evaluate broadband access in communities and institute policies and programs to increase access for areas with less connectivity. Businesses and non-profits can also use these statistics to analyze internet access in the communities that they serve. Below is a quick introduction to both of the datasets as well as how to map them.
About the US Census Computer, Internet & Broadband data
Dataset: US Census Bureau’s American Community Survey Most Current Year: 2018 (with 2019 data to be released in December 2020)
First Year Data Are Available:
- 2017 5 Year – For Small Geographies like zips/ZCTAs, Census tracts & block groups
- 2013 1 Year – For Large Geographies like states, MSAs, counties & cities
You may be aware of the US Census that counts US residents every 10 years. The same agency collects internet and broadband statistics annually. The most current data can be found in the U.S. Census Bureau’s release of the 2018 American Community Survey (ACS) . The 2019 data set will be available in December 2020.
The computer and internet use questions were mandated by the 2008 Broadband Improvement Act and added to the ACS in 2013. The questions are not asked for the group quarters population and do not include data about people living in housing such as dorms, prisons, nursing homes, etc.
If you need data about the ownership and usage of all types of computers, including desktops, laptops, smartphones, tablets, etc., the 2018 ACS is the right dataset. The data also includes whether any member of the household has access to the internet. “Access” refers to someone in the household using or connecting to the internet, regardless of the service fee they pay.
The ACS provides information about the type of internet service used by the U.S population:
- Cellular Data - a plan for a smartphone or other mobile device;
- Broadband (high speed) Internet service-fiber optic or DSL;
- Satellite;
- Dial-up or some other service.
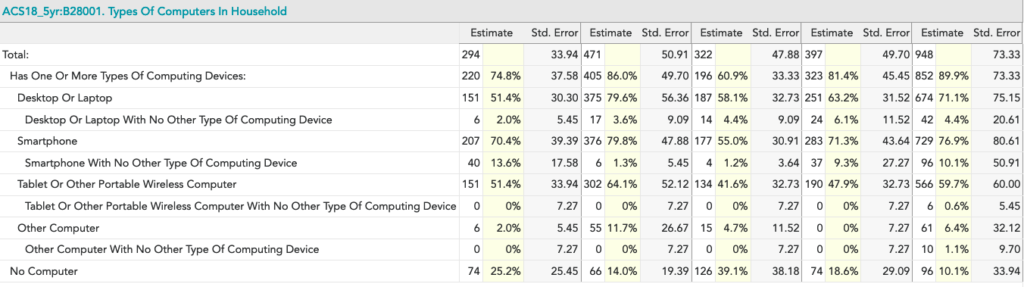
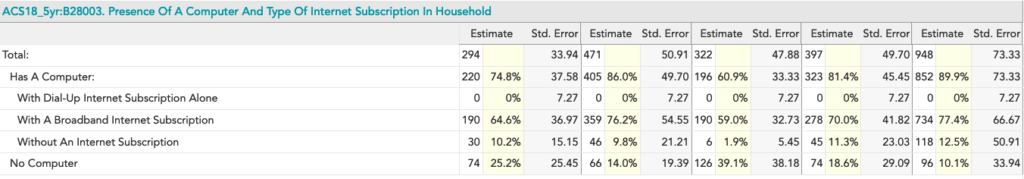
Let's take a glimpse into the most popular computer and internet access tables that I pull from the 2018 American Community Survey.
The above tables can be even more valuable when you add additional dimensions like computer or internet subscription by:
- Household Income,
- Age,
- Labor Force Status, and
- Race/Ethnicity.
For example, you can get income by internet access or computing device by race/ethnicity.
About the FCC Data Fixed Broadband Deployment Data
Dataset: FCC’s Fixed Broadband Deployment Data
Most Current Year: 2018 (with 2019 data to be released in December 2020)
Update: Data appears to be updated twice a year
Geographies: Census blocks
Census Blocks are typically bounded by streets, roads or creeks. In cities, a census block may correspond to a city block, but in rural areas where there are fewer roads, blocks may be limited by other features. The population of a census block varies greatly. As of the 2010 census, there were 4,871,270 blocks with a reported population of zero,while a block that is entirely occupied by an apartment complex might have several hundred inhabitants.
The Federal Communications Commission (FCC) monitors regional and global communications in all 50 states, the District of Columbia, and U.S. territories. The commission, managed by Congress, stands as the United States' primary authority for communications law, regulation, and technological innovation. The FCC use the Fixed Broadband Deployment statistics to measure the nationwide development of broadband access, as well as the successful deployment of the next generation of broadband technology.
Here's a sample of the raw FCC data.
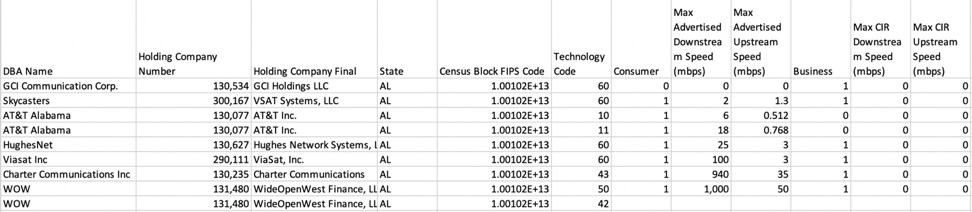
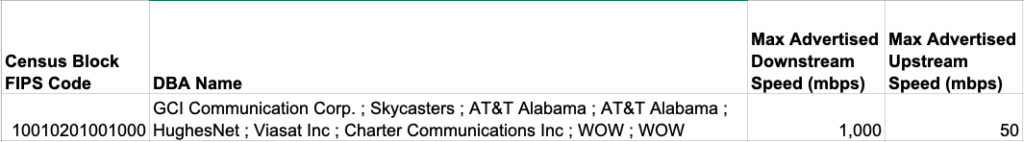
The projects that I’ve done in the past with this data involved identifying areas without high speed internet or broadband. To do this, we aggregate the data by block group to list all of the providers and identify the largest Max Advertized Download Speed and Max Advertised Upstream Speed. So that would look like the example below where I’ve concatenated all businesses offering internet service for a single Census block and identified the max speeds for all providers.
Aside: a client mentioned that the FCC data can be misleading because the FCC allows a provider to report the highest download and upstream speeds if just 1 household in the block has internet access at those speeds. I haven’t verified if this statement is true or false.
Broadband Map
You can map data from the U.S. Census Bureau and the FCC datasets to identify areas with slow internet connection. Here’s what what a quick broadband map looks like:
Here are some helpful hints for using the map.
- Turn layers on and off by checking the check-boxes beside the layer names.
- Turn on choropleth display (or colors) by clicking on Auto Style.
- Drag the slider handles left or right to filter.
Whew! Still reading? I’m impressed. So if you’ve gotten this far and you’re thinking, “Yeah, sure I could pull all of this data and build this map myself in a couple of days, but I have other important things to do and I really don’t want to sift through all of the data dictionaries, methodology statements and tool instructions to make sure that I have the most current data,” you are not alone. You sound just like our other clients at Cubit who depend on us to provide clean, accurate and easy-to-work-with data as well as human-to-human customer support. Prices start at $599 with a 3 business day turnaround. Tell me what data you need for what geography & I’ll get you a free quote & turnaround estimate.