I was working on a custom data request for a new business owner who was considering a particular location for a new venture. This owner wanted California traffic count data for the highway near the potential location. Here’s how I got traffic count data for this California state highway.
What’s a Postmile(& Why Should You Care)?
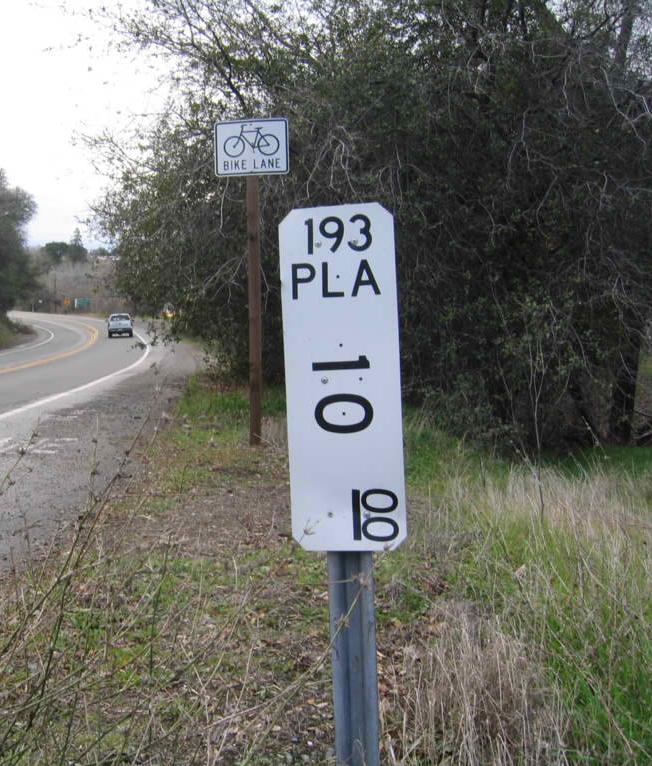
Wikipedia says “California uses a postmile highway location marker system on all of its state highways, including U.S. Routes and Interstate Highways. The postmile markers indicate the distance a route travels through individual counties, as opposed to mile markers that indicate the distance traveled through a state.” You should care about Postmiles, because you need to know the postmile to look up the traffic count data.
A. How to Lookup the Postmile
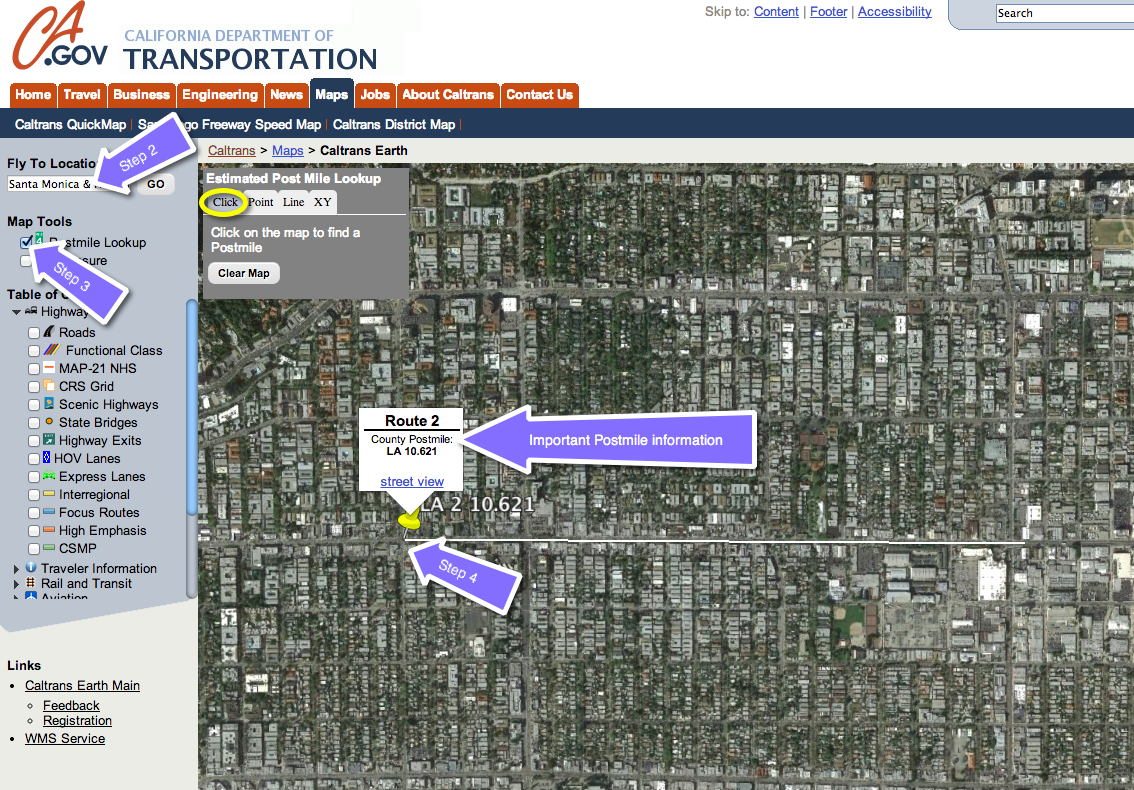
- Go to Caltrans Earth – which is a GIS provided by the California Department of Transportation.
- You will probably have to download the Earth for Web plugin. Clicking on the download plugin link provided by Caltrans didn’t work for me. So I searched for “GoogleEarth-Mac-Plugin-Latest.dmg” and found this site with the Mac version of the Google Earth Plugin. If you are running a PC, you’ll need to find the PC plug-in.
- Once you get the Caltrans Earth working, enter your area of interest to zoom to location.
- Note: since the data are state highways, your area of interest will likely be a state highway AND an intersecting street. The intersecting street can be a smaller road or it can also be another state highway. I’m going to use Santa Monica (Route 2) and North Crescent Heights in Los Angeles County as an example.
- Click on Postmile look up.
- WithClick selected in the Postmile look up tool, click on the map where your area of interest is. So in my example, I’m clicking on the intersection of Santa Monica (2) & North Crescent Heights. (You can turn on the Roads in the left navigation to see the street names).
- The map will then show you the closest County Postmile.

B. How to Use the Postmile to look up Traffic Counts
- Download the most current traffic volume data from the Caltrans Traffic Data Branch. The most current data that I could find was 2012. The department will release 2013 and 2014 traffic data as soon as it’s available, but for my purposes, 2012 is the best data available & will work.
- Here’s the 2012 traffic counts that we can use as an example. Looking at the data look first at the Route, then the County, and then the nearest post mile.

For our example, I’d want to double check that Highland Avenue is close to North Crescent Heights. And according to Google maps, Highland Avenue is 4 minutes or 1.6 miles away from North Crescent Heights.

C. How to Read the Traffic Count Data
- This handy Caltrans webpage provides us with some important definitions.
- Back AADT, Peak Month, and Peak Hour usually represents traffic South or West of the count location.
- Ahead AADT, Peak Month, and Peak Hour usually represents traffic North or East of the count location.
- Annual Average Daily Traffic(Annual ADT) is the total volume for the year divided by 365 days.
- Peak Hour is an estimate of the “peak hour” traffic at all points on the state highway system.
- Peak Month ADT is the average daily traffic for the month of heaviest traffic flow.
So with the above resources, you are now able to get traffic counts for California state highways. While Caltrans does not collect traffic data on locally maintained roads, oftentimes the city or county has a traffic engineer who has this data. If you need traffic counts for local roads, you should call the City and ask to speak with either the traffic engineer, Public works department or the Planning department.