Explore New Lists Updated with the Latest Census Data
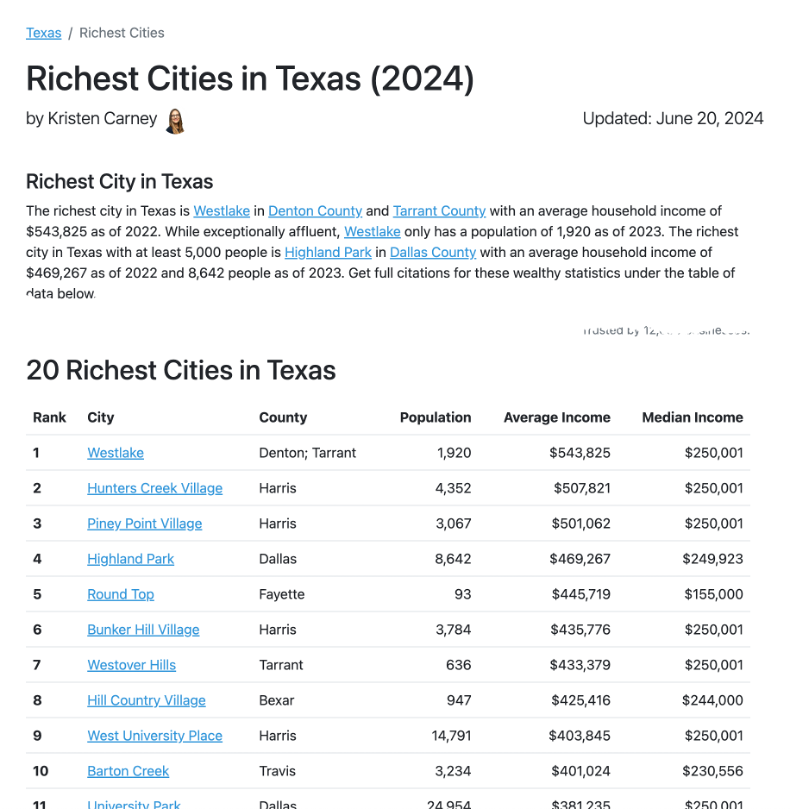
Are you curious about the wealthiest places in your state? We’ve got an exciting new free resource for you! At State-Demographics.com, we’ve compiled lists of the richest cities and counties in every state, using up-to-date data from the U.S. Census Bureau. Now, you can easily discover where wealth is concentrated in your state.
Richest Cities and Counties by State
Check out your state’s demographics using the links below:
We’d love to hear your thoughts on these lists—did any places surprise you? Let us know how we can make this resource even better by replying to this post.
Confidently Choose Your Next Best Location with Our Site Selection Analysis
Planning to open a new branch or office? Our Site Selection Analysis is here to help you make data-driven decisions that will maximize profitability and minimize risk. For just $999, you’ll gain insights into the best locations based on demographic and market data, ensuring your new location is set up for success.
Learn more about how we can assist with your next move: Site Selection Analysis.
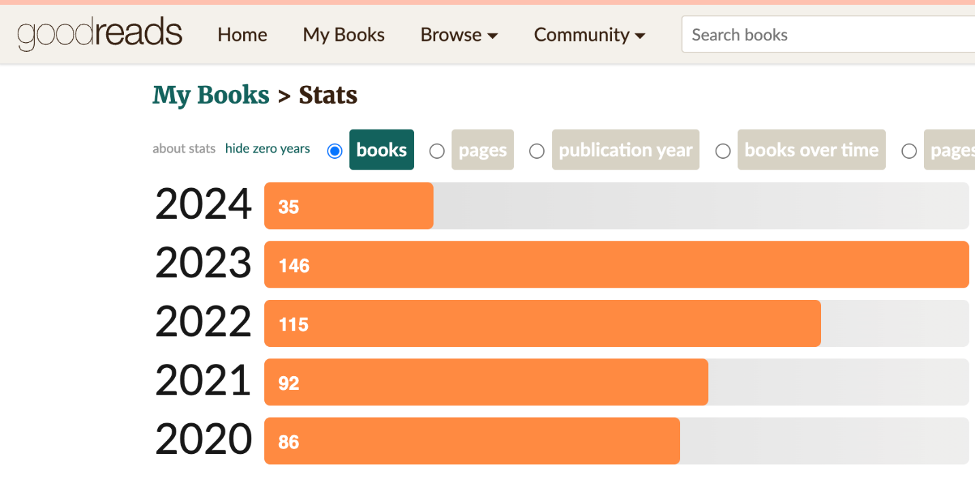
Summer Reads We Recommend
Summer is the perfect time to dive into new ideas. Here are three books that we’ve been reading, and we think you’ll enjoy them too:
- Invent and Wander: The Collected Writings of Jeff Bezos
This book offers a fascinating look at Jeff Bezos’ thought process and business philosophy. It’s a collection of his annual shareholder letters, featuring recurring themes like Day 1 mentality, customer-centricity, and bold decision-making. Fun fact: Bezos got his initial start-up capital – $100,000 at first, then more – from his parents. - Slow Productivity: The Lost Art of Accomplishment Without Burnout by Cal Newport
In this latest book, Newport explores how to get more done without the constant pressure of burnout. His previous book, Deep Work, transformed many readers’ work habits, but will his message of doing less resonate during the AI revolution? - A Brief History of Intelligence: Evolution, AI, and the Five Breakthroughs That Made Our Brains by Max Bennett
If you’re fascinated by the intersection of neuroscience and AI, this book by entrepreneur Max Bennett is for you. It’s a great summer read, highly recommended by Grit author Angela Duckworth on her podcast, No Stupid Questions.
Got any summer reading suggestions? Drop them in the comments below—we’d love to hear your recommendations!