Population Projections by County and by City for the US
Planning Data
Kristen Carney

Photo by Mario Purisic on Unsplash
Updated May 2025.
While the US Census Bureau doesn’t publish population projection data, each state individually produces projections that state agencies use to make policy decisions and that businesses can use to make business decisions. We include the population forecast data in Radius Reports and when requested in Custom Data projects. Below are 50 of our favorite population projection datasets for counties for each state in the US.
If you need projections for counties in different states, you'll need to purchase projections that use the the same methodology so that they'll be apples to apples comparable. We've teamed up with Cooke Demographics to provide such county population projections that include age and sex data for years 2022-2047. Learn more about our County Population Projections here: Link
Other companies that we have worked with in the past that provide county population projection data are AGS (Applied Geographic Solutions), Woods & Poole Economics, Nielsen and ESRI.
County Projections are handy and all, but what I really want are Population Projections by Cities.
I hear you! The smaller the geography, the better...as long as the data are accurate, right?
The first stop in your hunt for population forecasts for cities is to check the agency website in the table above. Some state agencies, like Arizona, provide population projections for cities along with counties. Be aware they might use an unexpected name for cities like sub-counties or places. So you'll want to do some digging through data files here rather than just reading the file names. After digging and if you still don't find the data you need, continue your search with the two options below.
If you need population projections for just 1 city…
You can often find population projection data for 1 city in the city’s comprehensive plan, and here’s how.
- Search for the city's comprehensive plan in Google (e.g. City of Austin comprehensive plan).
- TIP! Sometimes, you have to navigate to the city's website & then search for the plan on their site. It's usually linked from the planning department's webpage.
- When you find the plan, search in the text of the plan for the words "projection" or "population".
- TIP! If the text of the plan isn't searchable, look in the table of contents. Usually, there's a section in the table of contacts that's titled "environment" or "population." Sometimes, this section is in an Appendix, but usually, it's at the very beginning of the document. Read through only this section of the plan to see if you can find population projection data.
- Also consider how old the plan is. If the plan is older than 2010, consider looking for this data on the MPO's website (next step) first and then coming back to the comprehensive plan if you can't find it on the MPO's website.
If you need population projections for multiple cities in a region…
The metropolitan planning organization (MPO) often publishes population projections for multiple cities in a region to estimate traffic demand. MPOs are federally mandated and funded transportation policy-making organizations in the United States that are made up of representatives from local government and governmental transportation authorities (source). To find population forecasts in MPO planning documents, first you have to figure out if your city is in an MPO and if so, which MPO.
- If you don't already know, do a Google search for what county the city is in (e.g. "What county is Austin, Texas in?").
- Then google search for what MPO the county is in.
- TIP! You may have to google for a "map of MPOs for the state of _____" and use the map to figure this out.
- Go to the MPO's website and find the long range transportation plan. It's usually called something like MPO Year Plan (e.g. CAMPO 2040 Plan) or 2040 transportation plan.
- Open the plan, and search for the words "projection" or "population".
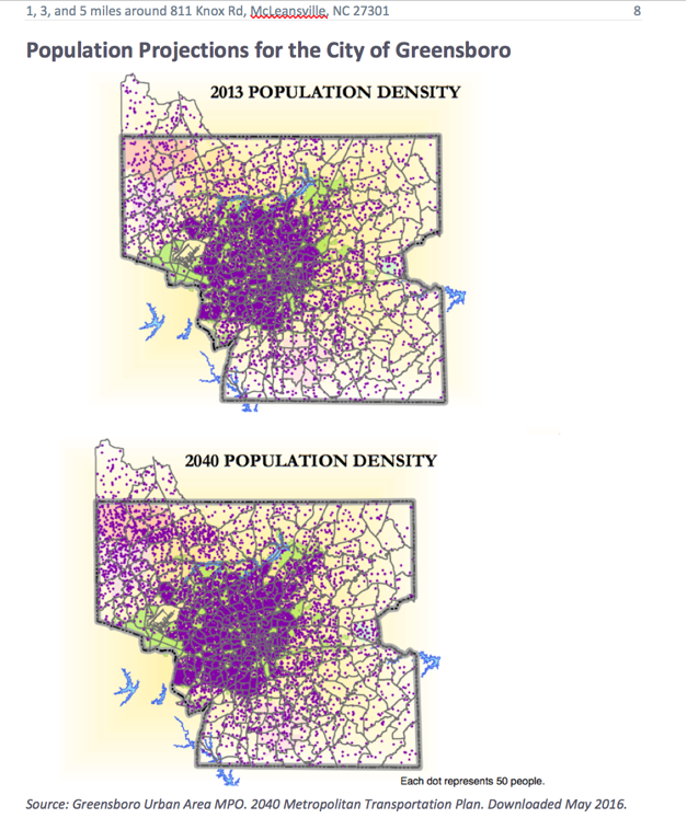
- Sometimes, the population projections in the plan are for cities. Other times, the population projections are for Traffic Analysis Zones (or TAZs). If we can't find population projections for cities, you can use the Traffic Analysis Zone map. See the sample below for what a TAZ population projection map could look like.
Don’t Have Time to Pull This Data Yourself?
Whew! Still reading? I’m impressed.
So if you’ve gotten this far and you’re thinking, “Yeah, sure I could pull all of this data myself in a couple of days, but I have other important things to do and I really don’t want to sift through all of the data dictionaries, methodology statements and tool instructions to make sure that I have the most current data for my area of interest,” you are not alone. You sound just like our other clients at Cubit who depend on us to provide clean, accurate and easy-to-work-with data as well as human-to-human customer support. You can get population projections, as well as hundreds of other data points, in a custom data pull. Prices start at $599 with a 3 business day turnaround. Tell me what data you need for what geography & I’ll get you a free quote & turnaround estimate.