Where to Find the Most Current US Zip Code Income Data

Recently, I did a little research for a custom data request about zip code income data for the entire US. I was looking for both historic & current income data. I found 2 different data sources that both provide current & historic US zip code income data: the US Census Bureau and the Statistics of Income program data on the IRS website.

The Least You Need to Know

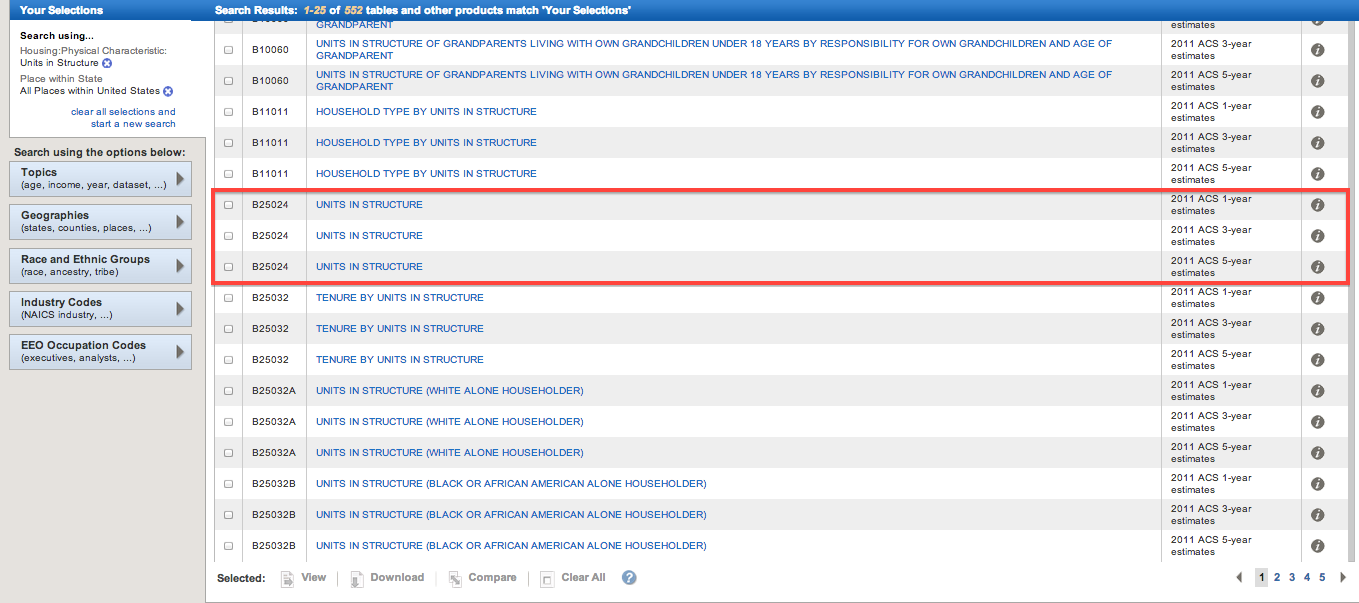
The most current zip code income dataset that’s available right now for the entire US is the US Census Bureau’s 2011 ACS 5 year estimates. An updated ACS dataset will be released every year (i.e. by the end of 2013, the 2012 income data will be released.)


Data Source 1: US Census Bureau

Year Dataset
2011 ACS 5 year estimates
2000 Decennial Census 2000 SF3 Data
1990? Census FTP site
1980? Census FTP site

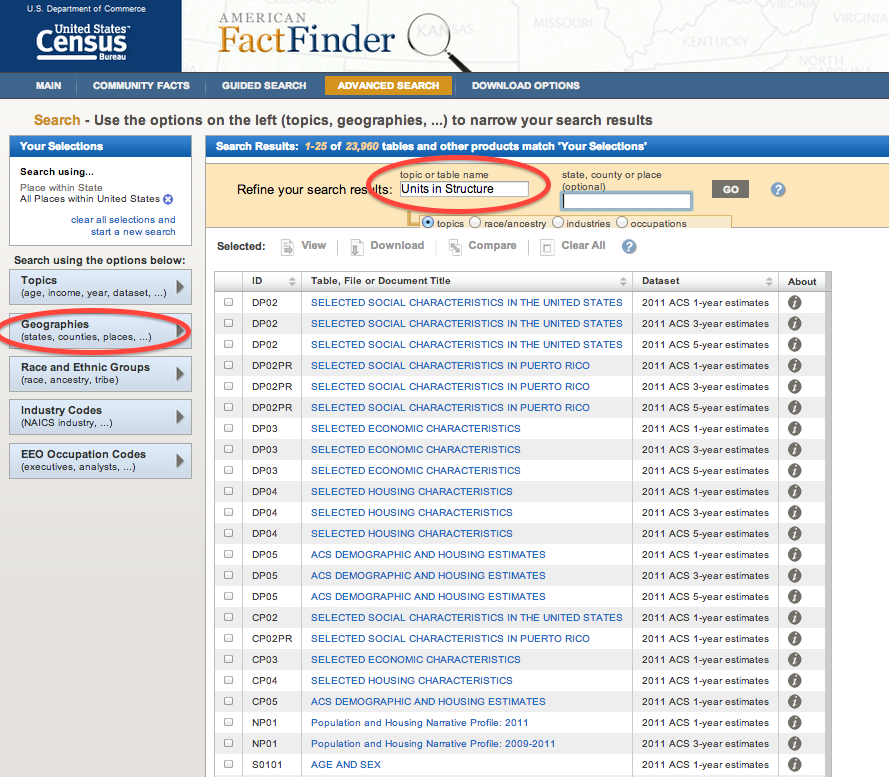
First, the US Census Bureau provides income data for zip code tabulations areas (ZCTAs) — which are very similar to zip codes. I’ve got another blog post that explains the difference between ZCTAs and zip codes.

You can pull income data by ZCTA for all US ZCTAs for the years 2000 and 2011 on the Census Bureau’s website. For the 2000 income data, you’ll want to use the Decennial Census 2000 SF3 dataset. For the 2011 income data, you’ll want to use the ACS 5 year estimates dataset. Learn more about ACS data vs Decennial Census data. Each year, the Census Bureau will release updated ACS income data (i.e. in 2013, they will release the 2012 income data).

While there are zip code level data for the 1990 & 1980 decennial censuses AND there are income data for the 1990 & 1980 decennial censuses, I haven’t done the necessary digging to figure out if there are 1990 & 1980 zip code income data available. You can do this research by reading through the documentation on the Census’ FTP site (links are in the table above).

Your next question is probably “what income related data points can I get from the US Census Bureau”?

Popular Zip Code Income Data for 2011

I’m defining popular as my personal favorite tables as well as the tables that I pull most often for custom data requests. Most of the data below are in 2011 inflation-adjusted dollars.

General

  • Mean Income in the Past 12 months
  • Median Income in the Past 12 months
  • Median Family Income in the Past 12 months
  • Per Capita Income in the Past 12 months

Household

  • Median Household Income in the Past 12 Months
  • Median Household Income in the Past 12 Months for White Alone Householder; Black or African American Alone Householder; American Indian and Alaska Native Alone Householder; Asian Alone Householder; Native Hawaiian and Other Pacific Islander Alone Householder; Some Other Race Alone Householder; Two or More Races Householder; Hispanic or Latino Householder

Type of Income

  • Wage or Salary Income in the Past 12 Months for Households
  • Self-Employment Income in the Past 12 Months for Households
  • Interest, Dividends, or Net Rental Income in the Past 12 Months for Households
  • Social Security Income in the Past 12 Months for Households
  • Supplemental Security Income (SSI) in the Past 12 Months for Households
  • Public Assistance Income or Food Stamps/Snap in the Past 12 Months for Households
  • Retirement Income in the Past 12 Months for Households

Poverty

  • Poverty Status in the Past 12 Months
  • Poverty Status in the Past 12 Months of Families by Family Type by Social Security Income by Supplemental Security Income (SSI) and Cash Public Assistance Income

Other

  • Gini Index of Income Inequality
  • Median Income in the Past 12 Months by Sex by Work Experience in the Past 12 Months for the Population 15 Years and over With Income
  • Receipt of Supplemental Security Income (SSI), Cash Public Assistance Income, or Food Stamps/Snap in the Past 12 Months by Household Type for Children Under 18 Years in Households

Popular Zip Code Income Data for 2000

I was going to put together a list of tables for 2000 income data like the above list of tables for 2011 income data, but when I was working on the list for 2000 income data tables, there was a lot of overlap. Basically, you can get 2000 income data tables that are similar to the 2011 income data tables with a couple of exceptions. For example, there’s no Gini Index of Income Inequality table for 2000. The 2000 income data are in 1999 dollars.


Data Source 2 – SOI Tax Stats on the IRS website

Year Dataset
2008 Free
2007 $500 for US/$25 per state
2006 $500 for US/$25 per state
2005 $500 for US/$25 per state
2004 $500 for US/$25 per state
2002 $500 for US/$25 per state
2001 Free
1998 Free

“SOI” stands for Statistics of Income. SOI is a program that publishes income data and is run by the Statistical Information Services, a US government agency.

The SOI is currently reviewing its methodology to safeguard individual taxpayer confidentiality. So the 2008 data set is a preliminary dataset that contains data for zip codes in which 250 or more returns were filed — which means that you won’t be able to get income data about rural zip codes from the preliminary data set. The data are based on individual income tax returns from the IRS’ Individual Master File system, which includes a record for every Form 1040, 1040, and 1040EZ. The records included in the 2008 dataset were returns that were filed between January 1, 2009 and December 31, 2009.

The 2008 dataset include the following data:

Number of returns [1]
Number of joint returns Filing Status is Marriedfiling jointly
Number of returns with paid preparer’s signature
Number of exemptions 1040:6d
Number of dependents 1040:6c
Adjust gross income (AGI) [2] 1040:37 / 1040A:21 /1040EZ:4
Salaries and wages 1040:7 / 1040A:7 /1040EZ:1
Taxable interest 1040:8a / 1040A:8a /1040EZ:2
Ordinary dividends 1040:9a / 1040A:9a
Business or professional net income(less loss) 1040:12
Net capital gain (less loss) 1040:13  1040A:10
Taxable individual retirement arrangements distributions 1040:15b / 1040:11b
Taxable pensions and annuities 1040:16b / 1040A:12b
Unemployment compensation [3] 1040:19 / 1040A:13 /1040EZ:3
Taxable Social Security benefits 1040:20b / 1040A:14b
Self-employment retirement plans 1040:28
Total itemized deductions [4] Schedule A:29
State and local income taxes Schedule A:5a
State and local general sales tax Schedule A:5b
Real estate taxes Schedule A:6
Taxes paid Schedule A:9
Mortgage interest paid Schedule A:10
Contributions Schedule A:19
Taxable income 1040:43 / 1040A:27 /1040EZ:6
Total tax credits [5] 1040:56 / 1040A:34
Residential energy tax credit Form 5695:27
Child tax credit 1040:52 / 1040A:32
Child and dependent care credit 1040:47 / 1040A:29
Earned income credit [6] 1040:66a / 1040A:40a / 1040EZ:8a
Excess earned income credit(refundable) [7] 1040:66a / 1040A:40a / 1040EZ:8a
Alternative minimum tax 6251:35
Income tax [8] 1040:56 / 1040A:28 /1040EZ:10
Total tax liability [9] 1040:61 / 1040A:37 /1040EZ: 10
Tax due at time of filing [10] 1040:76 / 1040A:46 /1040EZ:12
Overpayments refunded [11] 1040:73 / 1040A:44a / 1040EZ:11a

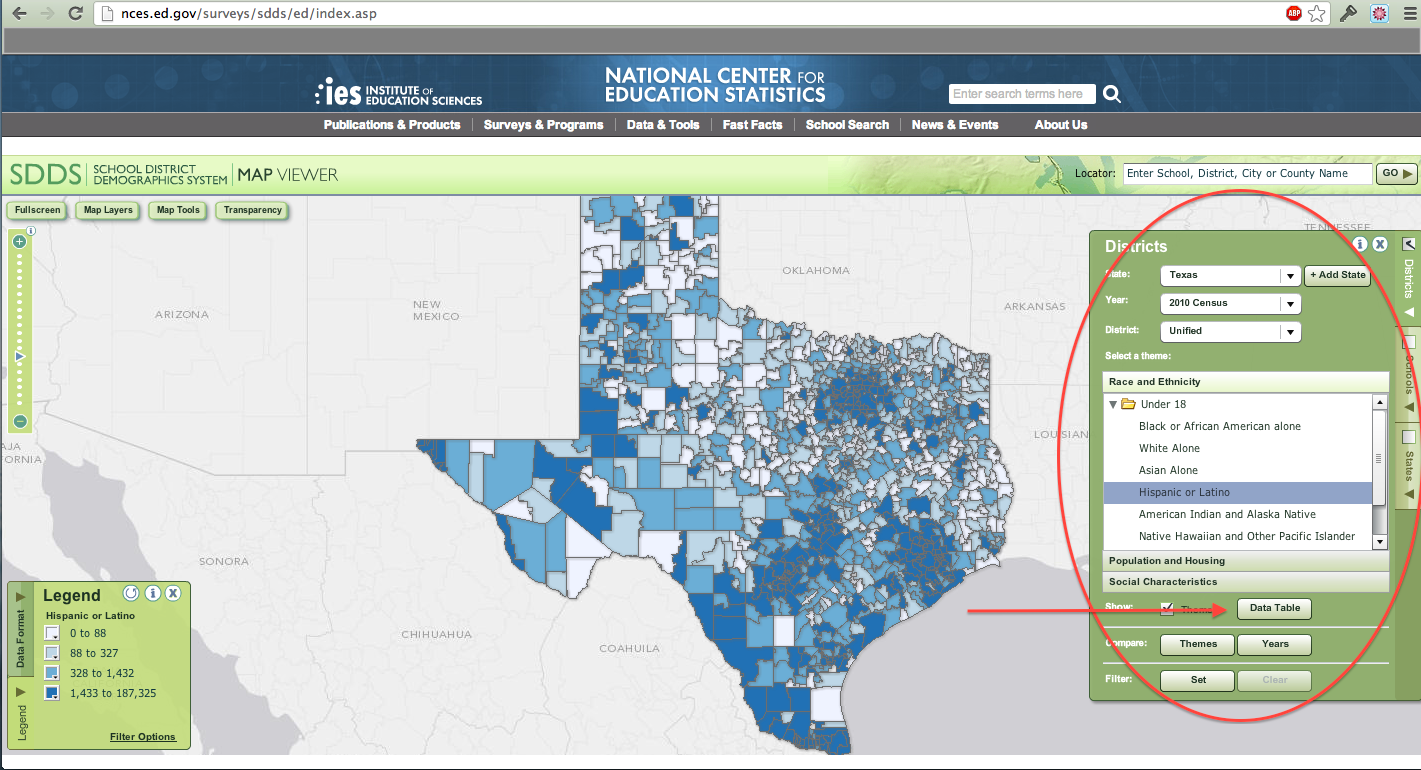
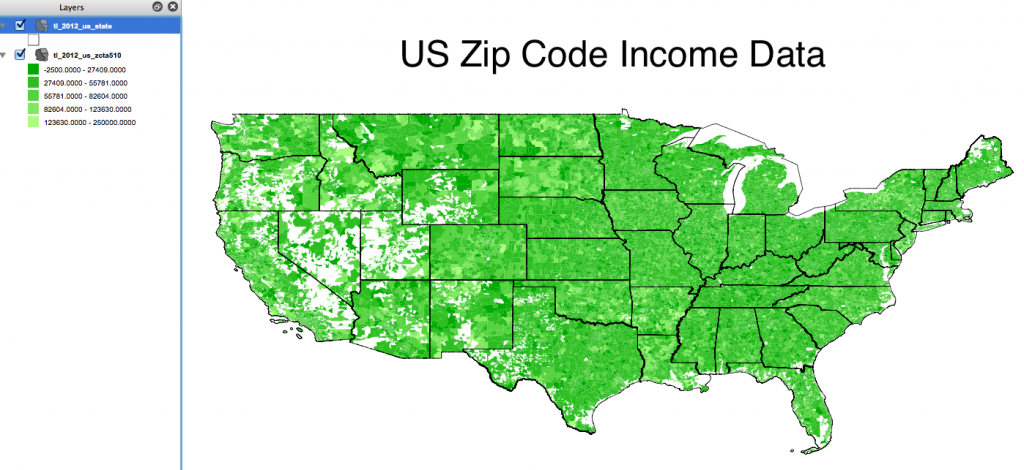
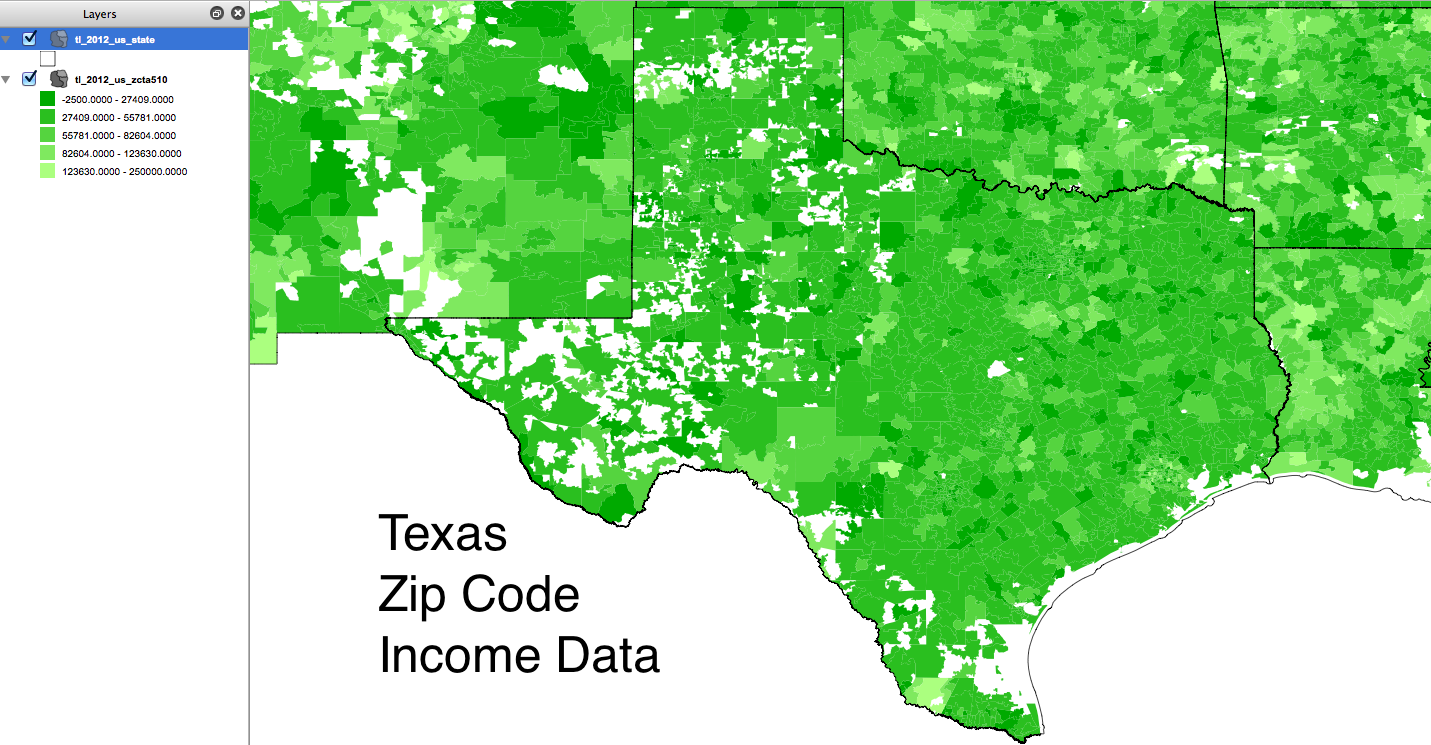
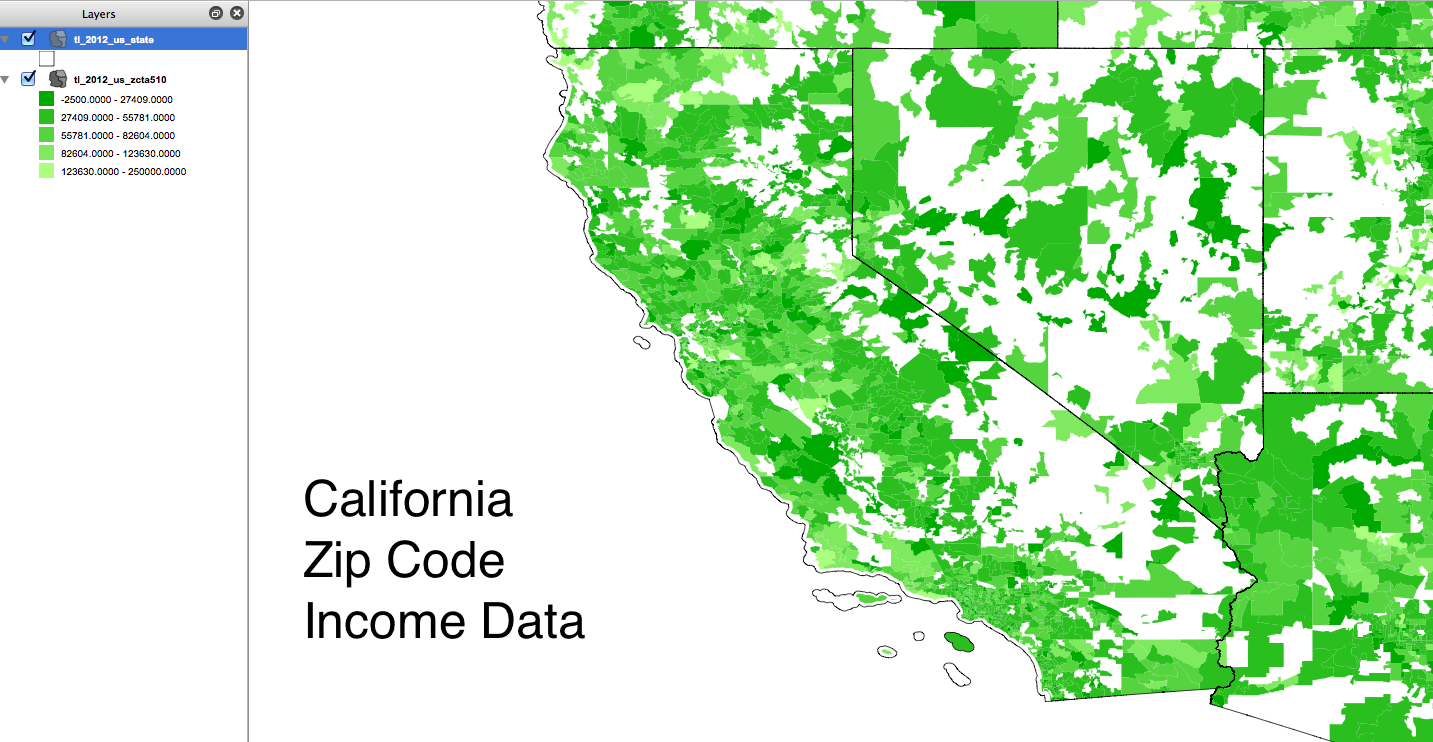
Zip Code Income Data Maps

Now that you know where to get income data for zip codes, you can use data to do some pretty cool analysis — like building zip code maps.

Here are some quick zip code income maps for the US and a couple of the largest states using the US Census Bureau’s 2011 data and my favorite free GIS – QGIS.

US Zip Code Income Data
Click to see a larger map.
Texas Zip Code Income Data
Click to see a larger map.
California Zip Code Income Data
Click to see a larger map.
New York Zip Code Income Data
Click to see a larger map.

Comparing Historic Income Data

If you are interested in looking at changes in income over time, you’ll probably want to adjust for inflation.


Don’t Have Time to do Any of the Above Work but Still Need Zip Code Income Data?

I pull zip code income data for businesses for a fee. If you’d like to get a quote for me to pull this data for you, please complete the Custom Data Request form.

Apartment Statistics that you can get from the US Census

Photo by Brandon Griggs on Unsplash

Image from JoeInSouthernCA

So you need apartment statistics.

I often get requests for apartment data from folks who are:
1. researching where to locate a business that provides services to apartment dwellers like a washateria or car wash; or
2. researching where to buy or build a new apartment facility (and the bank has asked them to include the number of apartment units in an area in their business plan).

What you might not know is that the US Census Bureau reports apartment statistics — which means you don’t HAVE to pay a ton of money to a real estate data company to get an estimate of the number of apartment units in a particular area.

How to get Apartment Statistics from the US Census

If you’d rather spend your time doing more interesting things than learning how to use the American Fact Finder 2 — you can always pay me to pull this data for you using the custom data request form. But just in case you are curious, a glutton for punishment or a college student doing research, here’s how:

1. Head over to the American Fact Finder 2 – Advanced Search.

2. In the Geographies tab on the left, select your geographic area of interest (i.e. New York city, NY or Cook County, Illinois).

3. Then type in these magic words into the search box: “Units in Structure”

Apartment Data - Units In Structure
See the Geography tab on the left & where to enter the magic words!

4. Then look for the Units in Structure table in the list.

Units In Structure Tables
There are 3 ACS Units in Structure tables.

5. Depending on the size of your geographic area & the margin of error that you are comfortable with, you’ll need to choose between the American Community Survey (ACS) 1 year, 3 year or 5 year data. As of today, the ACS 1 year 2011 data are the most current data available. Take a look at the margins of error in the different ACS products to see what table will be the best fit for your purposes.

Apartment Unit Margin Of Error Data
Look at the margin of error data to help you figure out if you want to use ACS 1 year, 3 year or 5 year data.

Fun fact! Now that you know how to pull data via the American Fact Finder 2, there are other statistics that you can get about apartments — not just Units in Structure data.


Understanding Your Apartment Statistics

Now you have your apartment data from the Census — but what do the row headings “1, attached”, “1, detached”, “2” actually mean? Here are the Census’ definitions per the American Community Survey definitions.

  • 1-Unit, Detached – This is a 1-unit structure detached from any other house, that is, with open space on all four sides. Such structures are considered detached even if they have an adjoining shed or garage. A one-family house that contains a business is considered detached as long as the building has open space on all four sides. Mobile homes to which one or more permanent rooms have been added or built also are included.
  • 1-Unit, Attached – This is a 1-unit structure that has one or more walls extending from ground to roof separating it from adjoining structures. In row houses (sometimes called 7 townhouses), double houses, or houses attached to nonresidential structures, each house is a separate, attached structure if the dividing or common wall goes from ground to roof.
  • 2 or More Apartments – These are units in structures containing 2 or more housing units, further categorized as units in structures with 2, 3 or 4, 5 to 9, 10 to 19, 20 to 49, and 50 or more apartments.
  • Boat, RV, Van, Etc. – This category is for any living quarters occupied as a housing unit that does not fit the previous categories. Examples that fit this category are houseboats, railroad cars, campers, and vans. Recreational vehicles, boats, vans, tents, railroad cars, and the like are included only if they are occupied as someone’s current place of residence.
  • Mobile Home – Both occupied and vacant mobile homes to which no permanent rooms have been added are counted in this category. Mobile homes used only for business purposes or for extra sleeping space and mobile homes for sale on a dealer’s lot, at the factory, or in storage are not counted in the housing inventory.

US Cities with the Most Apartment Units

Just for fun, here are the 40 US cities with the largest number of apartment units according to the American Community Survey 2011 data. No real surprises here. The cities with the largest populations have the most apartment units as do tourist and college towns.

Geography Apartment Units
1 New York, NY 2,829,021
2 Chicago, IL 849,096
3 Los Angeles, CA 781,045
4 Houston, TX 442,551
5 Dallas, TX 256,739
6 San Francisco, CA 256,289
7 San Diego, CA 228,212
8 Boston, MA 224,289
9 Philadelphia, PA 219,932
10 Phoenix, AZ 190,495
11 Washington, DC 183,906
12 Austin, TX 175,766
13 San Antonio, TX 173,339
14 Columbus, OH 160,684
15 Seattle, WA 157,533
16 Milwaukee, WI 143,193
17 Denver, CO 135,336
18 Miami, FL 121,343
19 Atlanta, GA 121,086
20 Indianapolis, IN 120,819
21 Charlotte, NC 111,772
22 Jacksonville, FL 110,341
23 Portland, OR 105,165
24 San Jose, CA 104,905
25 Nashville-Davidson, TN 103,981
26 Memphis, TN 100,851
27 Cleveland, OH 98,037
28 Baltimore, MD 96,381
29 Cincinnati, OH 96,051
30 Minneapolis, MN 94,733
31 Detroit, MI 93,888
32 San Juan, PR 93,132
33 St. Louis, MO 93,101
34 Urban Honolulu CDP, HI 92,137
35 Jersey, NJ 92,098
36 Las Vegas, NV 90,887
37 Long Beach, CA 90,168
38 Oakland, CA 90,024
39 Fort Worth, TX 86,814
40 Buffalo, NY 85,595

U.S. Census Bureau. 2011 American Community Survey: B25024 UNITS IN STRUCTURE. Retrieved February 26, 2013 from http://factfinder2.census.gov 


If you need help pulling apartment statistics for your area, let me know what data you need by filling out the custom data request form, and I’ll email you back with a quote.

How to Get US School District Population Data

Photo by Justin Eisner on Unsplash

Occasionally, I pull school district population data for clients as a custom data request. Here are 2 tools & 1 technique for pulling demographic data for school districts.

Background

While the US Census Bureau does help collect school district population data, I can’t find school district data on the Census Bureau’s website. For example while I can select “all school districts in New York” in the American Fact Finder 2, I can’t actually pull any demographic or population data for the school districts. The Census Bureau’s website says that they have a project called the Education Demographic and Geographic Estimates project which “produces a variety of geodemographic data for the National Center for Education Statistics.” Ah! Now we are getting somewhere.

Let’s head over to the National Center for Education Statistics website. They have a cool tool called the School District Demographics Systems (SDDS).

Tool 1: NCES’ School District Demographic Systems

  • Good for basic demographics & heat maps
  • Bad for detailed demographics & pulling the most current demographic data available

Positive: SDDS is Easy to Use

Make your selections in the green box to right, and the map will change accordingly. For example, here’s a map of the Under 18 Hispanic persons for all Texas Unified School Districts.

Texas School District Demographic Data Map

If you want the actual data that’s displayed on the map, click on the Data Table button. Then click the Save to File button. Pretty nifty, huh?

Texas School District Demographic Data Table

You can get the following data points:

  • Total Students
  • Total Population
  • Total Occupied Housing Units
  • Owner Occupied Housing Units
  • Renter Occupied Housing Units
  • Average Household Size
  • Average Family Size
  • Percentage – Householder/Male
  • Percentage – Householder/Female
  • White Alone
  • Black or African American alone
  • Asian Alone
  • Hispanic or Latino
  • American Indian and Alaska Native
  • Native Hawaiian and Other Pacific Islander
  • OtherMulti-Race
  • Total Population Under 18
  • Sex by Age Breakdown
  • Total Teachers
  • Total Librarians / Media Specialists
  • Total Revenue

Positive: SDDS Displays Individual Schools & School Boundaries

To see individual schools, select schools in the greenbox to the right. Zoom in to get more detailed data about individual schools. In the map below, you can see schools by type for schools in Harris County, Texas. In addition to school district boundaries, you can also get see individual school boundaries by clicking on Map Layers & changing the selections there.

School Population Data for Harris County Texas

Positive: Export Spatial Data for School Districts with the SDDS

If you want to build custom maps or do spatial analyses, you can also export the spatial data. Click on the Map Tools button, and then click on Get Spatial data. Select the data which best meets your needs – Census, ACS or SAIPE. If you don’t already know what dataset to use, you’ll probably need a little help from a demographic data nerd or spend a couple of hours digging on the Census Bureau’s website. The differences between these datasets are way more complicated than can be summarized in this blog post. Or you could just download all of the datasets & then pick between then later on.

Download Spatial Data for School Districts

Negative: Very Limited Data Points are available with the SDDS

So we’ve seen that the SDDS is an awesome and easy to use tool for pulling school district population data–kudos to the builders of this tool–but there’s a potential problem. What if you need data points for school districts that aren’t included in the list above? Here are just a few examples of data points that folks working with school district data want & can’t get from the SDDS (even though these data points below are published by the Census Bureau):

  • median household income
  • median home value
  • household type & family type
  • poverty data
  • unemployment rates
  • industry & occupation data
  • transportation statistics
  • educational attainment
  • languages spoken at home

Enter a 2nd NCES data tool.

Tool 2: NCES’  Demographic Profile Webmap

  • Good for more detailed demographic data & heat maps
  • Bad for getting the most current demographic data available

The Demographic Profile Webmap is another awesome tool that works like the SDDS tool with the added benefit of providing us with even more demographic data. Oh boy! The only problem is that as of today the Demographic Profile Webmap provides us the ACS 2006 -2010 data. The most current ACS 5 year dataset that is available today is 2007-2011. Hopefully, this app will be updated in the near future. But as of now, you can’t get the most current data from this tool.

Technique 3: GIS Analysis

Let’s say you want the most current data available for the number of people who speak Spanish in a school district. Here’s a very simplified outline of how to do this analysis (warning: if you don’t have a basic understanding of GIS, the following outline might be gibberish).

How to Estimate Data Points for School Districts that are not included in SDDS

  1. Download the school spatial boundaries. If you want school district boundaries, you can download them either from the SDDS (see above) or the Census Bureau’s website. If you want individual school boundaries, try the SDDS, but for the most current boundary data, you’ll probably need to contact either the school district or the state education agency.
  2. Download the Census boundaries for your area of interest (i.e. state, county, etc.). You can download these boundaries from the Census Bureau’s website. If you aren’t sure what geographic level to use, Census block groups are the smallest level of Census geography with almost all data points. But in the case of language data, we can get much more detailed language data for Census tracts than for block groups. So you may have to do some guess & check to determine the best Census geography to use.
  3. Use the school spatial boundaries as “cookie cutters” (aka calculate intersections) to cut out the Census boundaries that are contained within the school boundaries. Let’s pretend that Census Tract A, B & C are all contained within your school district boundary.
  4. Then pull the Census language data for Census Tracts A, B & C from the Census Bureau’s website. Now if you are a GIS guru, you could do this step along with step 2 & combine the demographic data with the spatial data. But if you are like me and are more comfortable working with databases than with GIS (GISs? I’m not sure how to pluralize GIS. Or is it like sheep – and GIS is the pural?), you can pull the demographic data at this point & write a quick query to grab only the data points that you need.
  5. Finally, sum the counts of Spanish speakers for Census Tract A, B, & C to produce your estimate of Spanish speakers in a school district. So if Tract A has 10 Spanish speakers, Tract B has 5 Spanish speakers & Tract C has 0 Spanish speakers, we can estimate that the school district has 15 Spanish speakers. Summation works well for basic count data, but if you need to estimate “median” values, you’ll probably need to use something like a weighted average calculation.

Hopefully, this post has armed you with enough tools & techniques that you can now pull the school district population data that you need. But if you’d rather not learn the difference between Decennial Census vs ACS data or when it’s better use use Census blocks vs block groups vs tracts, you can always hire me to pull this data for you.

Of ZIP Codes and ZCTAs

Photo by Blake Wheeler on Unsplash

Occasionally we get asked for ZIP Code-based Census data. We have to say that we don’t have ZIP Code data and neither does the Census. What!? That’s right! But don’t worry, we got your back – the Census publishes ZIP Code Tabulation Areas (ZCTA, pronounced ‘ziktah’).

To quote the Census:

“ZCTAs are generalized area representations of U.S. Postal Service (USPS) ZIP Code service areas. They represent the most frequently occurring five-digit ZIP Code found in a given area. Simply put, each ZCTA is built by aggregating 2010 Census blocks, whose addresses use a given ZIP Code. Each resulting ZCTA is then assigned the most frequently occurring ZIP Code as its ZCTA code.”

In a nutshell: ZCTA 78704 is a representative snapshot of ZIP Code 78704.

ZCTAs Rock! Here’s why:

ZCTAs map to US Census data; ZIP Codes don’t.

About ZIP Codes. We don’t have ZIP code boundaries, because the U.S. Postal Service doesn’t define or publish them. Also, some of ZIP Codes are just routes (a series of connected lines, not polygons).

ZIP Codes change constantly to help the USPS deliver mail more efficiently. That’s what ZIP Codes are designed for: delivery. If you’re planning delivery logistics, use ZIP codes. Some companies offer zip code boundary maps. They estimate (using a variety of methods) polygons based on groups of points, physical landmarks (like bodies of water), and other methods. Most companies have their own private/favorite method of estimating ZIP code boundaries. But because ZIP Codes change so often, boundary maps fall out of sync with US Census demographic data.

US Census Demographic Data + ZCTAs == AWESOME

ZCTAs are polygons fixed to match the census data. By using ZCTAs you get a consistent and accurate representation of a geographic area.

More info about ZCTAs from Census.gov

How to Cite Census Data, including American Community Survey Data

Photo by Beatriz Pérez Moya on Unsplash

So this blog post probably won’t be among the most captivating posts I’ve ever written. But it might help someone who is googling around for “how to cite Census data.”

UPDATE: this post was revised on May 8, 2013.

The citations below are in Modern Language Association format — or MLA. And the format of the citation that you’re going to use will depend on HOW you pull the Census data. For example if you use the Census Bureau’s American Fact Finder tool, you’ll use 1 format whereas if you use pull the data from the Census Bureau’s FTP site, you’ll use a different format.

How to Cite American Community Survey Data

1. Cite American Community Survey data pulled via the American Fact Finder (most popular)

United States Census Bureau / American FactFinder. “B11001 : Household Type (Including Living Alone).” 2007 – 2011 American Community Survey. U.S. Census Bureau’s American Community Survey Office, 2011. Web. 1 January 2013 <http://factfinder2.census.gov>.

Note: the date is the date that you pulled the data from the American Fact Finder.

2. Cite American Community Survey data pulled via the Census’ electronic files on the ftp site

United States Census Bureau.“Summary File.”2007 – 2011 American Community Survey. U.S. Census Bureau’s American Community Survey Office, 2013. Web. 1 January 2013 <http://ftp2.census.gov/>.

Note: the date is the date that you download the data from the ftp site.

How to Cite Decennial 2010 Census data

 1. Cite Census 2010 data pulled via the American Fact Finder (most popular)

United States Census Bureau / American FactFinder. “P12 : Sex by Age.” 2010 Census.U.S. Census Bureau, 2010.Web. 1 January 2013 <http://factfinder2.census.gov>.

Note: the date is the date that you pulled the data from the American Fact Finder.

 2. Cite Census 2010 data pulled via the Census’ electronic files on the ftp site

United States Census Bureau. 2010 Census.U.S. Census Bureau. 2010. Web. 1 January 2013 <http://www.census.gov/2010census/data/>.

Note: the date is the date that you download the data from the ftp site.

How to Cite Decennial 2000 Census data

1. Cite Census 2000 data pulled via the American Fact Finder

United States Census Bureau / American FactFinder.“Profile of General Demographic Characteristics: 2000 Census 2000 Summary File 1 (SF 1) 100% Data.” U.S. Census Bureau, 2000.Web. 1 January 2013 <http://factfinder.census.gov>.

Note: the date is the date that you pulled the data from the American Fact Finder.

Double Note: you can’t actually pull Census 2000 data from the the American Fact Finder 2. You used to be able to (or “used to could” for any Texans reading this post) get this data from the old American Fact Finder 1. So I’ll just leave this example here as a hypothetical example.  

 2. Cite Census 2000 data pulled via the Census’ electronic files on the ftp site

United States Census Bureau. 2000 Census.U.S. Census Bureau, 2000.Web. 1 January 2013 <http://www.census.gov/prod/cen2000/>.

Note: the date is the date that you download the data from the ftp site.