How to Get US School District Population Data
Planning Data
Kristen Carney

Photo by Justin Eisner on Unsplash
Occasionally, I pull school district population data for clients as a custom data request. Here are 2 tools & 1 technique for pulling demographic data for school districts.
Background
While the US Census Bureau does help collect school district population data, I can't find school district data on the Census Bureau's website. For example while I can select "all school districts in New York" in the American Fact Finder 2, I can't actually pull any demographic or population data for the school districts. The Census Bureau's website says that they have a project called the Education Demographic and Geographic Estimates project which "produces a variety of geodemographic data for the National Center for Education Statistics." Ah! Now we are getting somewhere.
Let's head over to the National Center for Education Statistics website. They have a cool tool called the School District Demographics Systems (SDDS).
Tool 1: NCES' School District Demographic Systems
- Good for basic demographics & heat maps
- Bad for detailed demographics & pulling the most current demographic data available
Positive: SDDS is Easy to Use
Make your selections in the green box to right, and the map will change accordingly. For example, here's a map of the Under 18 Hispanic persons for all Texas Unified School Districts.
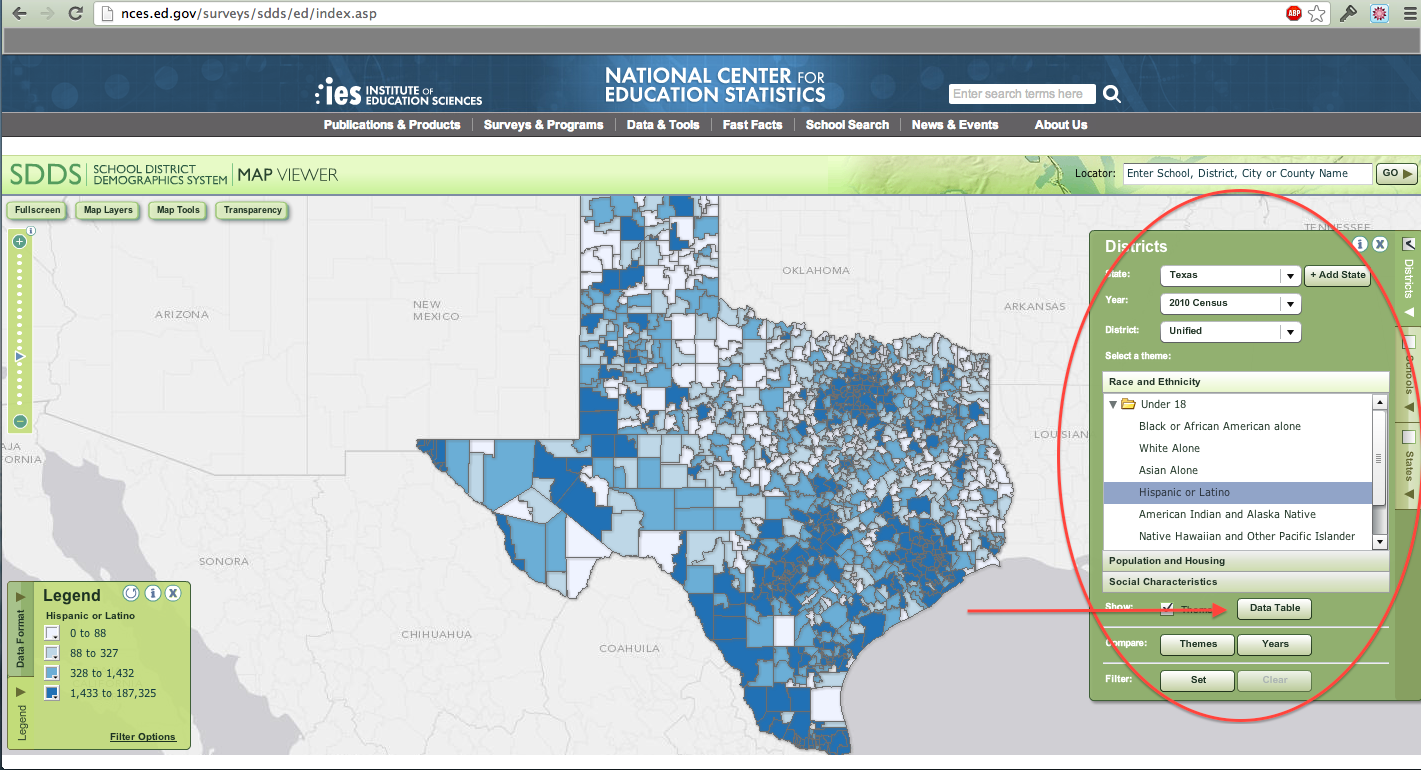
If you want the actual data that's displayed on the map, click on the Data Table button. Then click the Save to File button. Pretty nifty, huh?
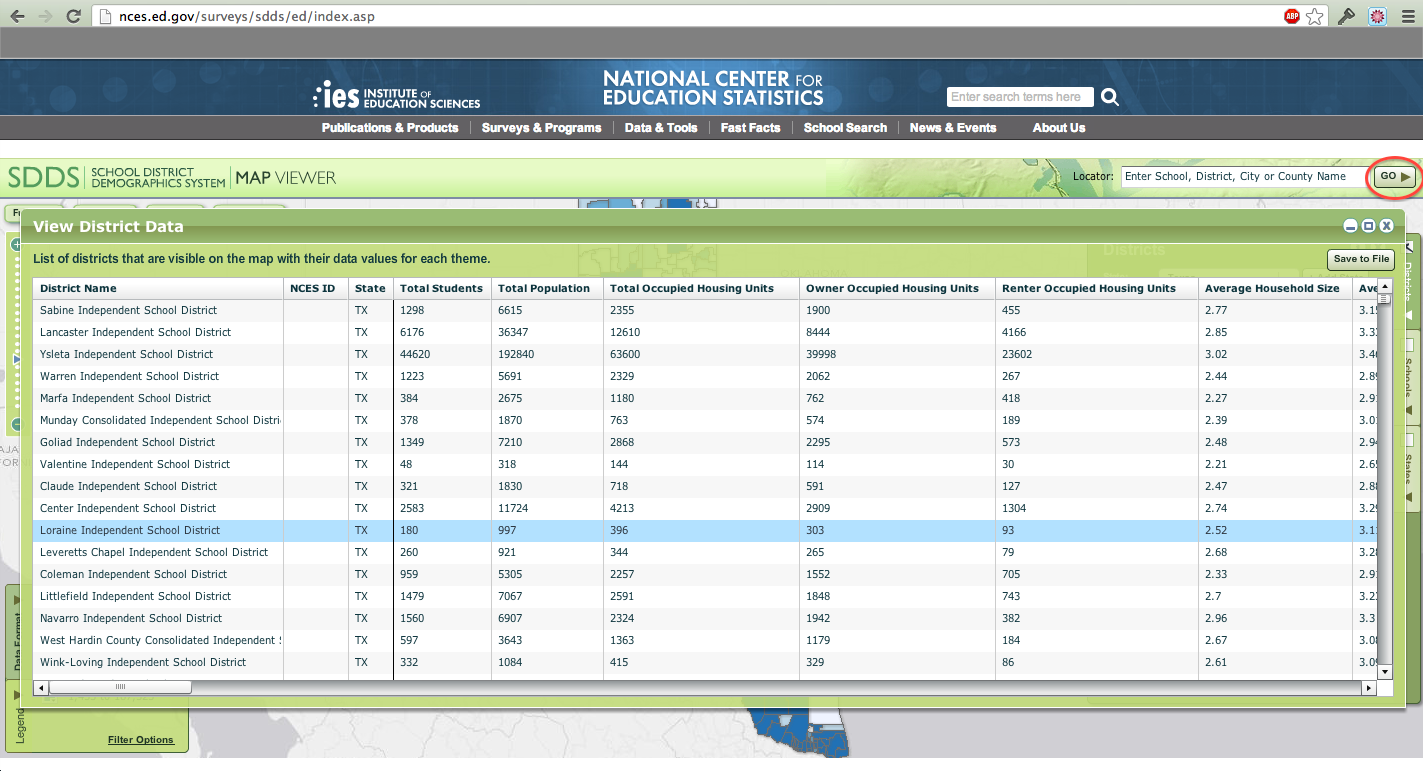
You can get the following data points:
- Total Students
- Total Population
- Total Occupied Housing Units
- Owner Occupied Housing Units
- Renter Occupied Housing Units
- Average Household Size
- Average Family Size
- Percentage - Householder/Male
- Percentage - Householder/Female
- White Alone
- Black or African American alone
- Asian Alone
- Hispanic or Latino
- American Indian and Alaska Native
- Native Hawaiian and Other Pacific Islander
- OtherMulti-Race
- Total Population Under 18
- Sex by Age Breakdown
- Total Teachers
- Total Librarians / Media Specialists
- Total Revenue
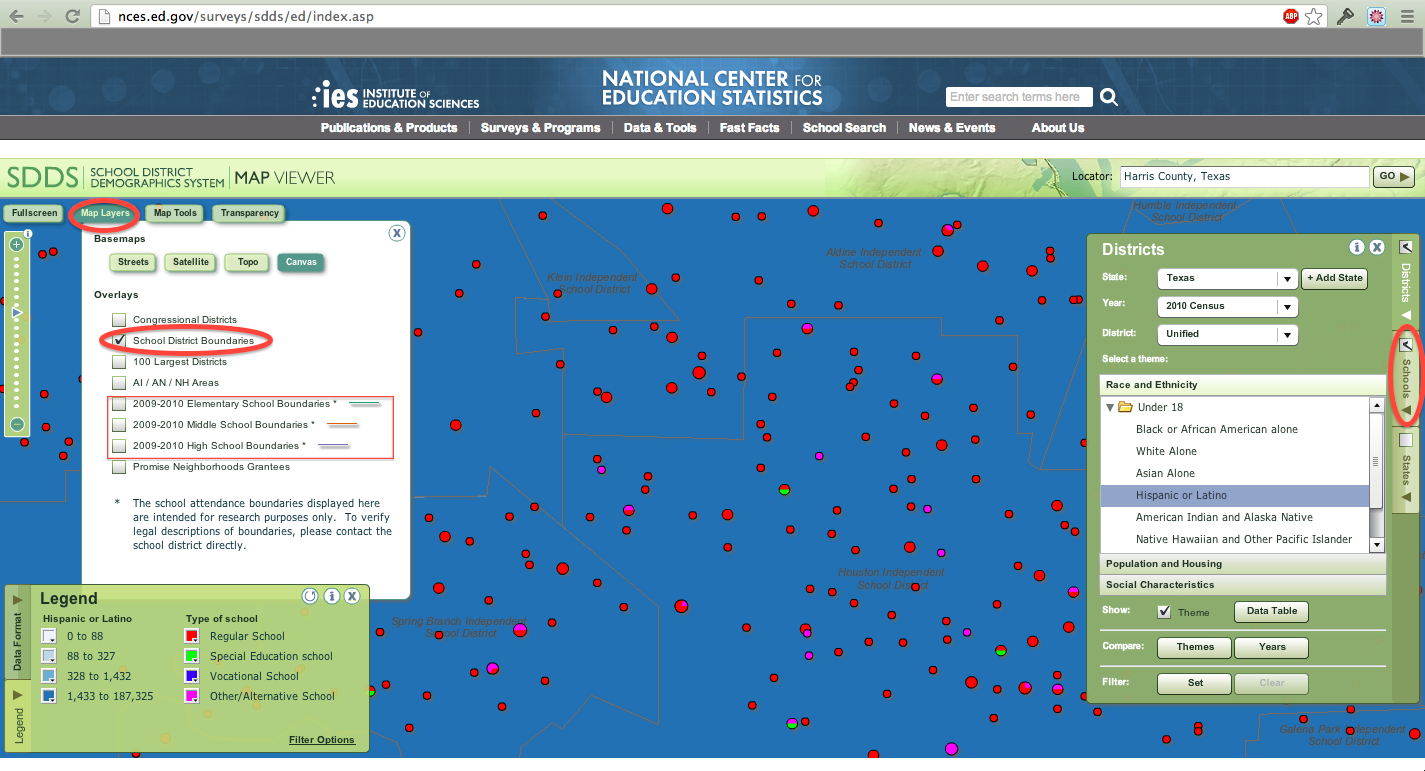
Positive: SDDS Displays Individual Schools & School Boundaries
To see individual schools, select schools in the greenbox to the right. Zoom in to get more detailed data about individual schools. In the map below, you can see schools by type for schools in Harris County, Texas. In addition to school district boundaries, you can also get see individual school boundaries by clicking on Map Layers & changing the selections there.
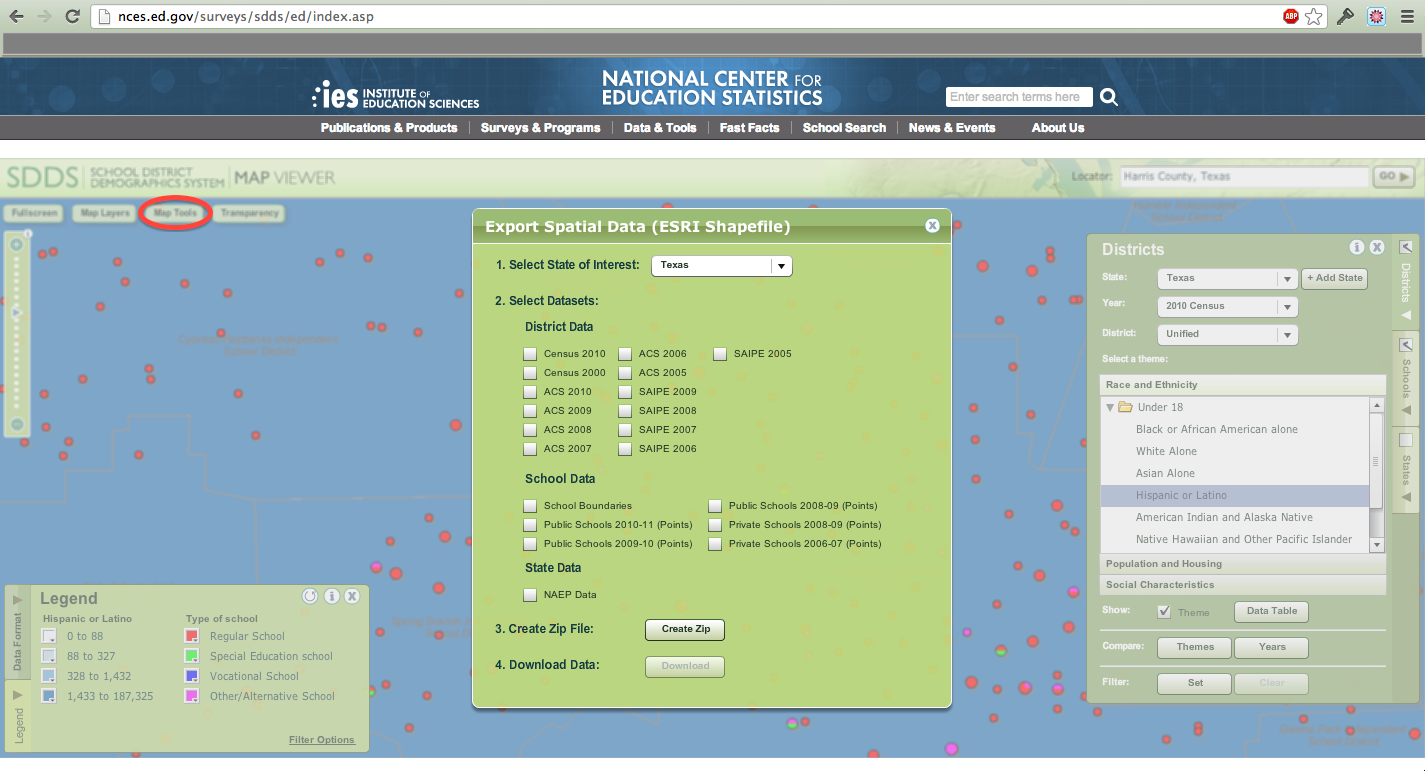
Positive: Export Spatial Data for School Districts with the SDDS
If you want to build custom maps or do spatial analyses, you can also export the spatial data. Click on the Map Tools button, and then click on Get Spatial data. Select the data which best meets your needs - Census, ACS or SAIPE. If you don't already know what dataset to use, you'll probably need a little help from a demographic data nerd or spend a couple of hours digging on the Census Bureau's website. The differences between these datasets are way more complicated than can be summarized in this blog post. Or you could just download all of the datasets & then pick between then later on.
Negative: Very Limited Data Points are available with the SDDS
So we've seen that the SDDS is an awesome and easy to use tool for pulling school district population data--kudos to the builders of this tool--but there's a potential problem. What if you need data points for school districts that aren't included in the list above? Here are just a few examples of data points that folks working with school district data want & can't get from the SDDS (even though these data points below are published by the Census Bureau):
- median household income
- median home value
- household type & family type
- poverty data
- unemployment rates
- industry & occupation data
- transportation statistics
- educational attainment
- languages spoken at home
Enter a 2nd NCES data tool.
Tool 2: NCES' Demographic Profile Webmap
- Good for more detailed demographic data & heat maps
- Bad for getting the most current demographic data available
The Demographic Profile Webmap is another awesome tool that works like the SDDS tool with the added benefit of providing us with even more demographic data. Oh boy! The only problem is that as of today the Demographic Profile Webmap provides us the ACS 2006 -2010 data. The most current ACS 5 year dataset that is available today is 2007-2011. Hopefully, this app will be updated in the near future. But as of now, you can't get the most current data from this tool.
Technique 3: GIS Analysis
Let's say you want the most current data available for the number of people who speak Spanish in a school district. Here's a very simplified outline of how to do this analysis (warning: if you don't have a basic understanding of GIS, the following outline might be gibberish).
How to Estimate Data Points for School Districts that are not included in SDDS
- Download the school spatial boundaries. If you want school district boundaries, you can download them either from the SDDS (see above) or the Census Bureau's website. If you want individual school boundaries, try the SDDS, but for the most current boundary data, you'll probably need to contact either the school district or the state education agency.
- Download the Census boundaries for your area of interest (i.e. state, county, etc.). You can download these boundaries from the Census Bureau's website. If you aren't sure what geographic level to use, Census block groups are the smallest level of Census geography with almost all data points. But in the case of language data, we can get much more detailed language data for Census tracts than for block groups. So you may have to do some guess & check to determine the best Census geography to use.
- Use the school spatial boundaries as "cookie cutters" (aka calculate intersections) to cut out the Census boundaries that are contained within the school boundaries. Let's pretend that Census Tract A, B & C are all contained within your school district boundary.
- Then pull the Census language data for Census Tracts A, B & C from the Census Bureau's website. Now if you are a GIS guru, you could do this step along with step 2 & combine the demographic data with the spatial data. But if you are like me and are more comfortable working with databases than with GIS (GISs? I'm not sure how to pluralize GIS. Or is it like sheep - and GIS is the pural?), you can pull the demographic data at this point & write a quick query to grab only the data points that you need.
- Finally, sum the counts of Spanish speakers for Census Tract A, B, & C to produce your estimate of Spanish speakers in a school district. So if Tract A has 10 Spanish speakers, Tract B has 5 Spanish speakers & Tract C has 0 Spanish speakers, we can estimate that the school district has 15 Spanish speakers. Summation works well for basic count data, but if you need to estimate "median" values, you'll probably need to use something like a weighted average calculation.
Hopefully, this post has armed you with enough tools & techniques that you can now pull the school district population data that you need. But if you'd rather not learn the difference between Decennial Census vs ACS data or when it's better use use Census blocks vs block groups vs tracts, you can always hire me to pull this data for you.