Or if you need to look up the 2014 population for your city, you can find that data for free by clicking on your state and then navigation to your city: https://www.cubitplanning.com/data/quick-reports
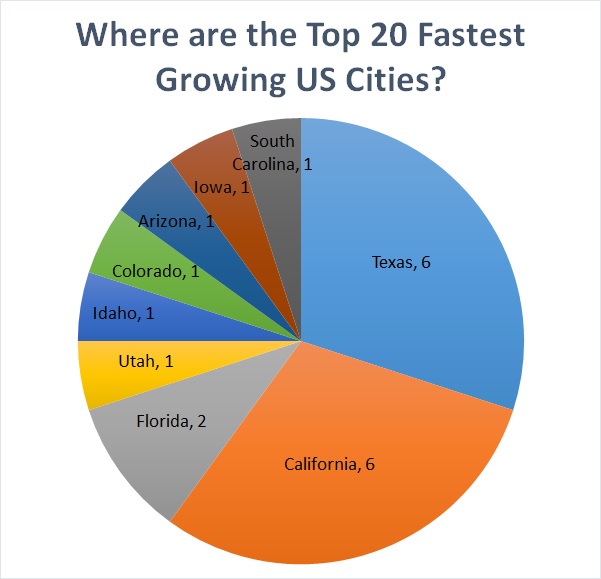
Texas and California respectively contain 6 of the top 20 fastest growing Cities.
Since I live in central Texas (Austin to be precise), I’m not surprised to see San Marcos, Georgetown or New Braunfels on the above list. I’m seeing tremendous changes in the smaller cities surrounding Austin, especially as the housing prices & rent rates in Austin are increasing.
Or if you need to look up the 2014 population for your county, you can find that data for free by 1. clicking on your state and then 2. navigating to your county’s page starting here: https://www.cubitplanning.com/data/quick-reports
Texas contains 7 of the top 20 fastest growing counties while Florida has 4 counties.
Source: US Census Bureau, 2014 Population Estimates, Released March 26, 2015.
Unsurprising: Texas and Florida
As a Central Texan who lives near to Hays, Comal & Williamson Counties, I’m not surprised to see these 3 counties in the top 20 fastest growing list. With solid job opportunities and a reasonable cost of living, continued population growth in Texas is likely.
As for Florida, I’d be interested to pull age data for the new residents. Is this Florida population growth due to Baby Boomer retirees, or are families and young couples moving there in search of job opportunities?
Surprising: North Dakota and Where’s California?
With 2 North Dakota counties at the top of the fastest 100 growing counties list, it appears that the North Dakota oil boom continued to attract workers through 2014. And surprisingly, no California counties appear in the top 20 list this year.
I was working on a custom data request for a new business owner who was considering a particular location for a new venture. This owner wanted California traffic count data for the highway near the potential location. Here’s how I got traffic count data for this California state highway.
What’s a Postmile(& Why Should You Care)?
Wikipedia says “California uses a postmile highway location marker system on all of its state highways, including U.S. Routes and Interstate Highways. The postmile markers indicate the distance a route travels through individual counties, as opposed to mile markers that indicate the distance traveled through a state.” You should care about Postmiles, because you need to know the postmile to look up the traffic count data.
A. How to Lookup the Postmile
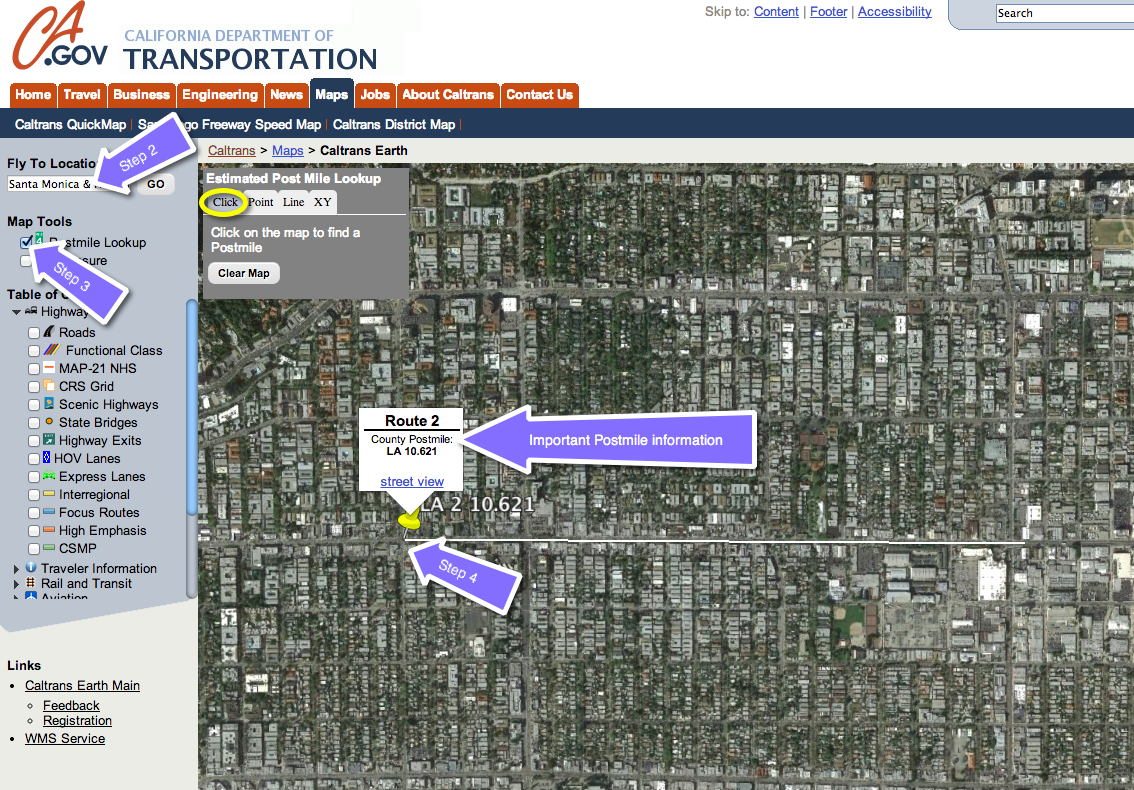
Go to Caltrans Earth – which is a GIS provided by the California Department of Transportation.
You will probably have to download the Earth for Web plugin. Clicking on the download plugin link provided by Caltrans didn’t work for me. So I searched for “GoogleEarth-Mac-Plugin-Latest.dmg” and found this site with the Mac version of the Google Earth Plugin. If you are running a PC, you’ll need to find the PC plug-in.
Once you get the Caltrans Earth working, enter your area of interest to zoom to location.
Note: since the data are state highways, your area of interest will likely be a state highway AND an intersecting street. The intersecting street can be a smaller road or it can also be another state highway. I’m going to use Santa Monica (Route 2) and North Crescent Heights in Los Angeles County as an example.
Click on Postmile look up.
WithClick selected in the Postmile look up tool, click on the map where your area of interest is. So in my example, I’m clicking on the intersection of Santa Monica (2) & North Crescent Heights. (You can turn on the Roads in the left navigation to see the street names).
The map will then show you the closest County Postmile.
B. How to Use the Postmile to look up Traffic Counts
Download the most current traffic volume data from the Caltrans Traffic Data Branch. The most current data that I could find was 2012. The department will release 2013 and 2014 traffic data as soon as it’s available, but for my purposes, 2012 is the best data available & will work.
Here’s the 2012 traffic counts that we can use as an example. Looking at the data look first at the Route, then the County, and then the nearest post mile.
For our example, I’d want to double check that Highland Avenue is close to North Crescent Heights. And according to Google maps, Highland Avenue is 4 minutes or 1.6 miles away from North Crescent Heights.
C. How to Read the Traffic Count Data
This handy Caltrans webpage provides us with some important definitions.
Back AADT, Peak Month, and Peak Hour usually represents traffic South or West of the count location.
Ahead AADT, Peak Month, and Peak Hour usually represents traffic North or East of the count location.
Annual Average Daily Traffic(Annual ADT) is the total volume for the year divided by 365 days.
Peak Hour is an estimate of the “peak hour” traffic at all points on the state highway system.
Peak Month ADT is the average daily traffic for the month of heaviest traffic flow.
So with the above resources, you are now able to get traffic counts for California state highways. While Caltrans does not collect traffic data on locally maintained roads, oftentimes the city or county has a traffic engineer who has this data. If you need traffic counts for local roads, you should call the City and ask to speak with either the traffic engineer, Public works department or the Planning department.
How to pull Building Construction Permit data for Counties from the US Census Bureau
For a recent custom data request, I pulled building construction permit data for US counties and places (aka cities). Many people don’t realize that the US Census Bureau collects data on building permits by county and place, and makes it publicly available.
Below are step by step instructions for how to pull this building construction permit data from the US Census Bureau’s website. We’ll use Orange County, Florida as an example — but the same steps apply if you want to pull data for a city.
Step-by-Step Guide to Finding Building Permits by County
The building permits page of the US Census allows you to search for building permits either monthly or yearly, going back to 1996. Not all areas report to the Census Bureau monthly – some only report yearly.
If when you are searching for building permit data you cannot find the county or place you are searching for, go back and change your search to “Yearly.” And there may be cases where building permit data are just NOT available for smaller counties (in terms of population) and smaller cities.
Now, here are the steps to follow:
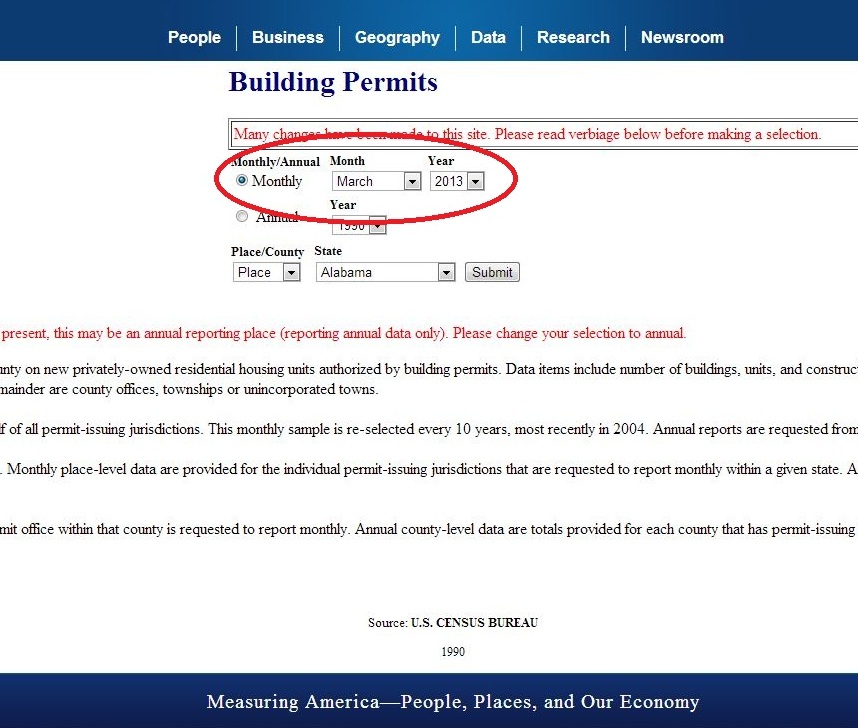
Step 1: On the building permits page, choose the month and year you want building permit data for.
Home Page where it all begins
Step 2: Pick county or place. Place reports are usually from individual municipalities, but some townships or unincorporated towns also report to the Census Bureau.
Step 3: Pick the state you are interested in finding data from. For our example here, we’ll be looking at Counties in Florida.
Steps 2 and 3
Step 4: Click “Submit”
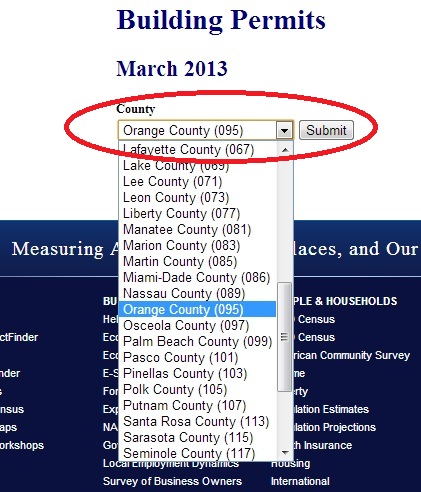
Step 5: On the next page, pick the county you want data from. Let’s pick Orange County. If the county we were looking for wasn’t listed, that would mean some of the municipalities in the county only report yearly, so we’d have to go back to the prior page and change our time to annual.
We’ll select Orange County as an example
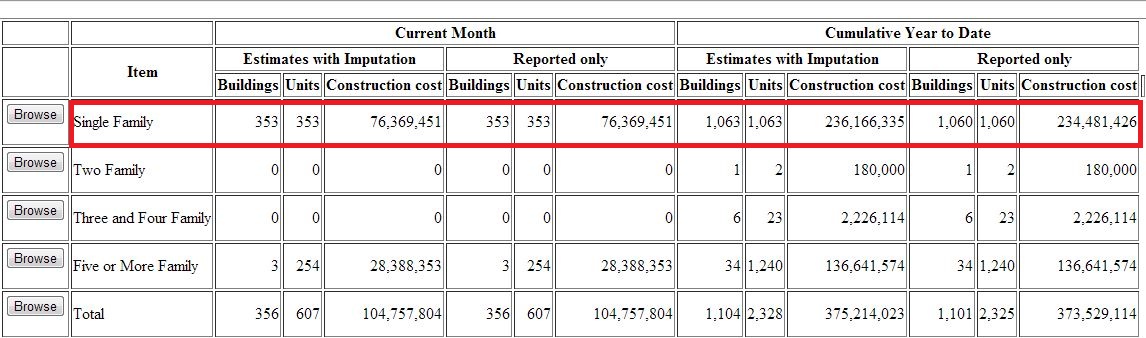
Once you click “Submit” on the second page, you will see the data building permits in Orange County for the month you selected. The information is broken down into permits for Single Family, Two Family, Three and Four Family, Five and More Family, and the total for all building types. In March of 2013, we can see that 353 Single Family building permits were reported, that there were 353 units in those buildings and that the construction cost was $76,359,451. We can also see the US Census Bureau’s estimate of building permits including any that may not have been reported (353 for March, so the same number reported.) The chart also includes totals for the year so far.
You will see the data building permits in Orange County for the month you selected
In the very left column of the chart there is a “Browse” button. Clicking on this allows us to compare building permits by county throughout Florida. We can choose to compare building permits by county for a specific type of building, or the total building permits in each county. If we “Browse” Five and More Family buildings, we can see that while Orange county only reported 3 building permits for this building category in March, Miami-Dade reported 13 building permits for the county. Clicking on the “Profile” button for Orange County brings us back to the building permits by county page for Orange that we came from.
This allows us to compare building permits by county throughout Florida
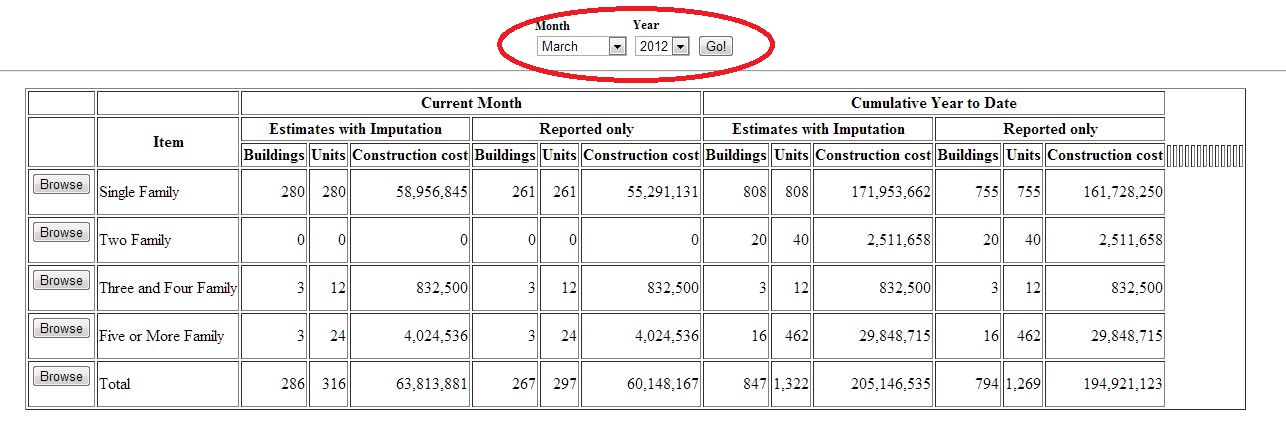
At the top of this page, you will see drop down boxes for month and year. If you want to compare building permits for Orange County for March in different years, you can pick 2012 from the drop down menu and see that Orange County reports only 267 building permits issued in March of 2012 – meaning nearly 100 more building permits were reported in 2013.
If you want to compare building permits for Orange County for March in different years, you can pick 2012 from the drop down menu
I hope the above steps and screenshots save you time when pulling building construction permit data for counties. If you need to pull lots of building permit data, like all monthly permit data since 1996, or if you need to pull building permit data AND other types of Census data (like year structure built, median value, median rent, etc.), you should check out Cubit’s custom data pull option.
Recently for a custom data request project, I needed to find historic home sales data by zip code for the entire United States. While the US Census Bureau has median home value data for ZCTAs, you can’t get count of sales or sale prices for individual home sales data from the Census datasets.
In addition to the Census Bureau, the county appraisal districts are a fantastic source of real estate data. But in Texas, you can’t even get home sales data from the county appraisal districts, because Texas law makes reporting home sales optional. And even for states unlike Texas that do require the reporting of home sales, it would be painful, time consuming, and expensive to contact every county appraisal district/office in the United States & request this data.
Below are all of the options that I explored to get historic home sales data by zip code for the entire US.
2 Viable Options to get Historic Home Sales Data by Zip Code
BEST OPTION – Purchase the data from DataQuick. DataQuick has been selling real estate data for over 30 years. They have reasonable prices. For example, I could get 2 data points (like number of sales and median sale price) for each MONTH for zip codes in the US for the past 10 years for $10,000. If I needed historic home sales data by zip code for the previous 10 years, that price was $7,000. And if I wanted additional data points in addition to the 2 mentioned above, each data point was $1,000 for 10 years. This pricing structure was easy for me to understand and to communicate. Also, DataQuick returned my phone calls quickly and were pleasant to work with. Their turnaround time for the data was 4 days. But there’s one small catch – they only have 70% coverage of US zip codes – which I understand to be based on population. Basically, you can get home sales data for the 70% of US zip codes with the largest populations. For the custom data request research that I was doing, 70% of zip codes was good enough. One could assume that the smaller the population, the fewer home sales are likely. But if you HAVE to have a higher coverage level than 70% of US zip codes, I did find a second option for you.
Buy the data for Real Quest. Real Quest is a division of CoreLogic – which is also a company that sells real estate data. The benefit of Real Quest is that they have data for 98 to 99% of residential properties in the US. That’s pretty impressive. What wasn’t impressive was their customer service or their pricing. I never could get a price quote from the sales person who was “helping” me. The best I could get is that “we’ll work with you if you have a $50K budget.” The other specific issue that bugged me was that they kept asking me to identify my client who I was doing research for – which I wasn’t comfortable doing without permission from my client. Since I had such a poor experience with their sales person, I hesitate to even list these guys as a viable option. But I can’t overlook the 98-99% data coverage.
Not Viable Options For My Purposes But These Options Might Work For You
Policy Map. Policy Map looks to be a pretty sweet web app for pulling demographic data. I keep meaning to sign up for a free trial & check ‘em out, but it never gets to the top of my to-do list. Policy Map wasn’t a good fit for this particular request, because their sales data only went back to 2006. It appears they have number of sales, median sale price, aggregate sales amounts & loan-to-value ratios on a quarterly basis for 2007 to 2012 and on an annual basis for 2006 to 2007. 1 note: you can’t access this data as part of the Free Account.
Regional Multiple Listing Services (MLS). A real estate multiple listing service is basically a shared database of that allows real estate brokers & realtors to see what homes are for sale & have currently sold in the past. There are 900+ regional multiple listing services in the United State. During my research, someone told me that there are 935 MLSs over the phone & I haven’t been able to verify it. I did find this link with data sources indicating that the number is between 900 and 1000. And then I found to buy access to 1 MLS would be $350. A rough estimate of 1,000 MLS x $350 for access = $350K. And if that price point is no problem, I think [emphasis on think – I stopped digging into this option at this point] you have to be a realtor/have a real estate license to get access to a MLS.
Real Estate data APIs like Trulia & Zillow. Using an API like Trulia or Zillow to get sales data was my idea for where to go to get historic home sales data by zip code. But when Anthony actually read the terms of service for the APIs, it was against the terms & service of the APIs for us to use them in such a way that we could pull all current & historic sales data for the US. Both Trulia & Zillow implement throttling limits, which I presume, prevents someone from downloading their entire database.
National Association of Realtors. While they have home sales data, they don’t have it at the zip code level.
Realtor.com. These guys never emailed or called me back.
Update August 2020: Since I wrote this blog post, I’ve pulled home data from Attom Data before they were Attom Data (I can’t remember their old business name). And a prospect mentioned to me that that they would be sourcing vacant land data from Data Tree. So you might try these 2 companies as well.
I hope this information saves you some serious time, because it took me awhile to piece it all together. If you know of another way to get historic home sales data for US zip codes, please contact me. I’m interested!