Crunch: Housing Cost Affordability for US Metro Areas
Planning Data
Kristen Carney

Are you aware of how housing costs impact your customers' spending habits? Understanding the financial burdens of your customers can help you tailor your marketing and sales strategies. For instance, in states like Florida, Nevada, and California, a higher percentage of renters are housing-burdened, which impacts their discretionary spending.
The Definition
The Department of Housing and Urban Development considers those who pay more than 30% of their income on housing to be “housing-burdened.”
Renters vs. Homeowners: Who's More Burdened by Housing Costs?
It turns out, over half of the renters in the US are shouldering a significant housing cost burden. In 2022, a staggering 52% of renters and 23% of homeowners spent more than 30% of their income on housing (source: US Census). While these figures have fluctuated over the past decade, they remain high.
Prices of Homes Rising.
Nationally, the cost of homes has soared by 74% from 2010 to 2022, outpacing wage growth which saw a 54% increase (sources: Bureau of Labor Statistics, Federal Housing Finance Agency). This widening gap can significantly impact consumer spending power.
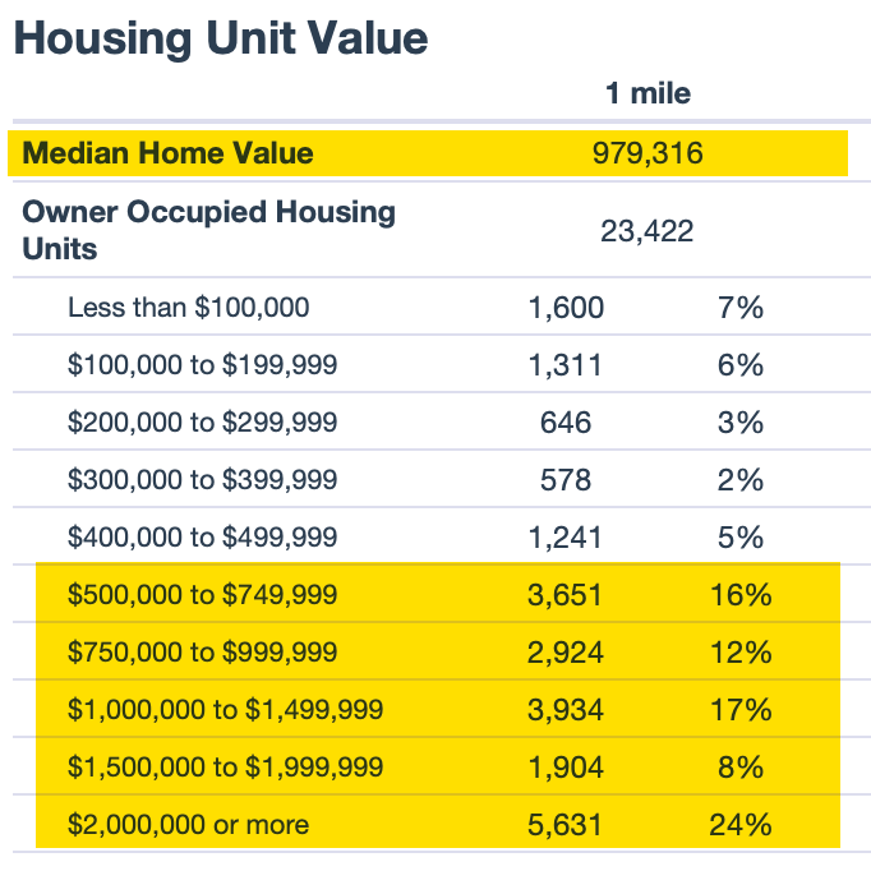
Because of this trend in rising home prices, we recently added more high value categories to our radius reports. The example below is a location in New York City.
Let’s go Low, Low, Low, Low, Low, Low, Low, Low
While I love USAFacts’ analysis of housing burden by state and tenure, state geographies are usually too large for most business owners to use in their decision-making. So let’s look at similar data for metro areas.
List of Metro areas sorted by housing burdened owners
You can download this Google Sheet to sort and filter for your markets by going here: https://docs.google.com/spreadsheets/d/1dbOFaxboBGYtMqbqoERqvtbWy_4Cs8ZJYgKye1IdaQY/edit#gid=0 Then click on File/Download.
Most housing burdened markets for owners with mortgages
The 2022 American Community Survey data presented lists the percentage of housing units with a mortgage that cost the owner 30% or more of their income in various U.S. metropolitan areas. Two areas tie for the highest percentage, Kahului-Wailuku-Lahaina in Hawaii and Aguadilla-Isabela in Puerto Rico, both at 43.7%. The Yauco metro area in Puerto Rico follows at 41.6%, and the Los Angeles-Long Beach-Anaheim area in California is close behind at 41.5%.
The data suggests that homeowners in these regions are likely to spend a significant portion of their income on housing costs, which can be indicative of high housing prices, low incomes, or a combination of both. Notably, three of the top five areas with the highest owner costs are in Puerto Rico, highlighting a potential regional pattern of housing affordability challenges.
Most housing burdened markets for renters
- High Rental Cost Burden: All the listed MSAs have more than half of their renters spending over 30% of their income on rent, indicating a high rental cost burden in these areas. This suggests that affordability is a significant issue for renters in these regions.
- Florida's Rental Market: Florida appears prominently on this list, with four MSAs featured: Gainesville, Punta Gorda, The Villages, and Naples-Marco Island, with Miami-Fort Lauderdale-Pompano Beach having the highest percentage at 62.6%. This points towards a statewide trend of high rental costs relative to income in Florida.
- Diversity of Locations: The MSAs are geographically diverse, covering various parts of the country including the East Coast, West Coast, and the Mountain States. However, there is a noticeable cluster in the state of Florida, suggesting regional market dynamics that affect rental affordability.
- College Towns: Several of the MSAs listed, like Gainesville, FL (University of Florida), Boulder, CO (University of Colorado), and Ithaca, NY (Cornell University), are known as college towns. This could imply that the presence of a large student population may drive up rental prices due to demand, possibly impacting the affordability for non-student renters as well.
- Variation in Cost Burden: While the percentage of renters experiencing a high cost burden is significant in all these MSAs, there is a noticeable variation, with Gainesville at the lower end (58.7%) and Miami-Fort Lauderdale at the higher end (62.6%). This variation might reflect differences in local economies, housing supply constraints, and demographic pressures.
Need housing burden data for smaller geographies than MSAs?
We can help. You can request this data as your 1 free table add on when you purchase a spreadsheet report. Or for $100, you can get a custom manual calculation added to your radius report.
Got more questions about housing burden data? Send me a message, and we’ll be talking about data in no time.
Sources:
Bureau of Labor Statistics
- Quarterly Census of Employment and Wages (updated March 8, 2023)
Federal Housing Finance Agency
- Annual House Price Indexes - Counties (Developmental Index; Not Seasonally Adjusted), Annual House Price Indexes - States (Developmental Index; Not Seasonally Adjusted) Updated March 28, 2023
US Census Bureau
- 2022 American Community Survey 1 Year (updated September 2023)