3 Best Sources for Free Parcel Data

Photo by Alex Bertha on Unsplash

I recently got a question from a Cubit user about where to get parcel data. I’ve shared our conversation in hopes that it might answer other peoples’ questions about where to find parcel and real estate data.

The Question: Where Do I Find Parcel Data?

Where to Find Parcel Data
Piecing together parcel data. Image from: www.thegoldguys.blogspot.com

“I’m working on my final project for my masters program & am excited to use Cubit for all the demographic data I’ll need. In the meantime, I need to gather real estate data on recent sales of residential & commercial property in Los Angeles county. The data also needs to include characteristics such as parcel size, structure size, & use. I’ve heard of the MetroScan database, but don’t know how to access it without paying thousands of dollars to CoreLogic. Do you have any ideas on other ways of accessing data like this?”

My Reply — Including the 3 Best Sources for Free Parcel Data

Funny you should ask–we’re actually working on developing a Cubit-like tool for parcel data. But it will include Travis County, Texas parcels only at first. If folks like it, hopefully, we can expand to the rest of the US!

Back to your question, here’s a quick brain dump of free or cheap parcel data tools/sources.

  • LoopNet:the standard for commercial property data
  • Zillow’s Tool Recent Home Sales
  • “parcel size, structure size, and use” That’s where things get tricky. You may know this already, but whenever I need parcel data, I start by contacting 3 government agencies:
    1. the Appraisal District or Tax Assessor,
    2. the Metropolitan Planning Organization or Council of Government and
    3. the City GIS office.

    I’d then use address info provided by Zillow and LoopNet to pull the parcel data from the government agency database.

  • Also, in Texas we have a real estate data center as part of Texas A&M that rocks! I wonder if California has a similar resource.

A quick google search turned up that you can buy parcel data from here: http://assessor.lacounty.gov/extranet/Outsidesales/saleintr.aspx
Similar data cost me $85 for all of Travis County, Texas as a reference point. Maybe they’ll give you a student discount? Or offer to share the results of your research with them?
That’s all I can think of. Let me know how it goes!

Are there other good sources of free/cheap parcel data that aren’t included in this blog post? If so, please share in the comments.

2 Ways to Figure Out Census Tracts by City

[UPDATE: WE NO LONGER OFFER FREE TRIALS FOR THE WEB APP]

You have 2 options for figuring out which Census tracts are in your city. Important Note: What you and me and other normal people would call cities or towns, the Census Bureau calls places.

Option 1. Census Tracts by City for Complex Cities (i.e. New York City, Los Angeles, Chicago)

    • Go to the Census Bureau’s website here: http://www.census.gov/cgi-bin/geo/shapefiles2010/main
    • Download the 2010 Places File for your State & unzip the file.
    • Download the 2010 Census Tract File for the county that your city is in & unzip the file.
    • Open the files in your favorite GIS. My current favorite GIS is the free, light-weight MapWindow.
    • Use the GIS to calculate which Census Tracts intersect your city. I wrote down step-by-step instructions for how to do this via Map Window. You can download these instructions here.

These instructions are a great example of what really happens when you use open source GIS to solve a problem, because I ran into an error when I was using MapWindow. So I included the error & 2 different ways to solve the problem in the instructions.

Also, you can follow the instructions above to figure out block groups by city as well as Census blocks by city.

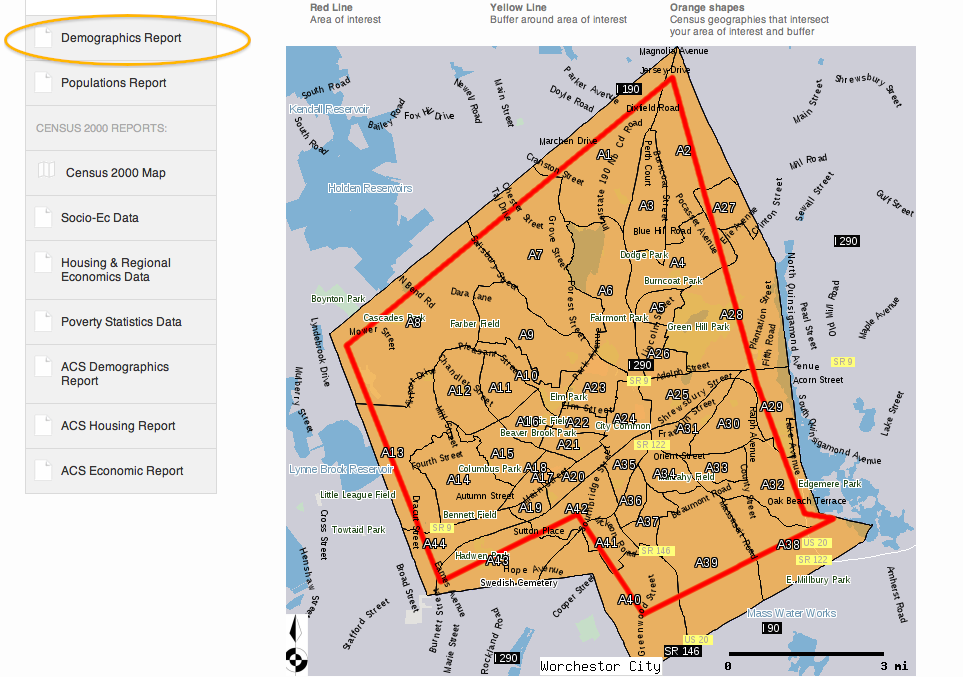
Option 2. Census Tracts by City for Simple Cities (i.e. Worchestor, MA, Shoshoni, WY)

  • Sign up for a 7 day free trial of Cubit.
  • In Cubit, type the name of the city into the Find Box to zoom to your city (see the Orange Circle).
  • Zoom out slightly until you can see the entire City in the interactive map. The city outline will be a slightly different color than the rest of the map (see the Orange Arrow-the darker shade is the city limits).
  • Click on the Polygon tool and draw a polygon slightly inside of the city limits (see the Orange box). Select Tract as the Geography Level if you want Census tract data (see the Purple box). Click Save.

On the next page, you’ll get a labeled map that shows the Census tracts in your city as well as demographic data reports.

Note: if you save your project and Cubit returns a Census tract that you can see is outside of your city, don’t panic. All that means is that some part of your line touched an area that is outside of the city. Click on the Edit Project button. Then, click on the Polygon button. Now, click on the points on your original line to adjust your line inside of the city so that you’ll only get tracts inside of your city. If nothing happens when you click on your original line, try clicking on different points along the line.

Again, you can follow the instructions above to figure out block groups by city as well as Census blocks by city.

The Really Nerdy Background

This blog post came about when I received a request to pull all Census tracts for a city. “No problem,” I thought, “I’ll just go to the Census 2010 data and look up the Places code for Census tracts.”

So I pulled up the Census 2010 data in MySQL and displayed all of the Census Tracts for my state of interest, Massachusetts. Great! There 1478 Census Tracts in Massachusetts. Then, I selected all Census Tracts in Massachusetts where the Place FIPS was not empty. Oh no! That returned 0 rows! That means there are no relationships in the Census 2010 data between Census tracts & Place.

Just to make sure I wasn’t missing something, I double checked the Census 2010 Redistricting PDF Summary Level Sequence Chart, and sure enough, there were no SumLevels with relationships from Cities to Census Tracts (or to BlockGroups or to Blocks for that matter). But don’t take my word for it–click on the link above in this paragraph and go to Summary Level Sequence Chart on page 4-1 to see for yourself.

So you’ll have to use either of the 2 methods above to figure out which Census tracts by City instead using relationships in the raw Census data. Was this post about Census tracts by City helpful or confusing? Any questions here?

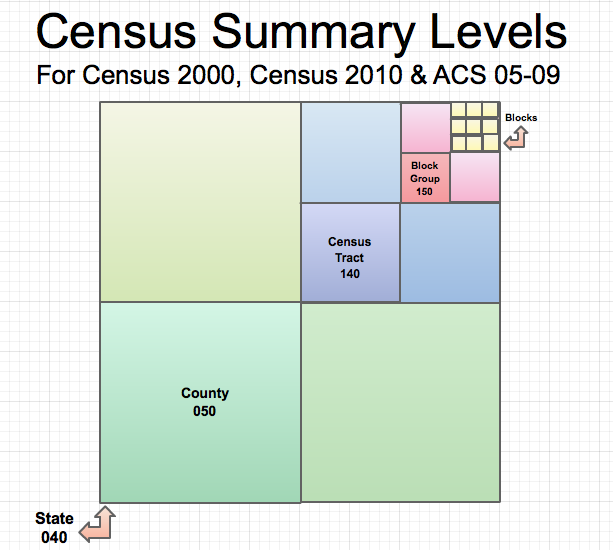
What are Census Summary Levels (SUMLEV)?

If you’re using Mara’s excellent instructions for working with Census 2010 data, you’ll need to know about Summary Levels or SUMLEVs in step 6.

What are Census Summary Levels (SUMLEV)?

Simple Answer: SUMLEV is a Census Bureau code to indicate geography type. For example, in the raw Census 2010 data, all states have a SUMLEV code of “040.”

A Touch of Complexity: SUMLEVs also designate hierarchical relationships for the geographies. For example, a SUMLEV of “050” indicates a County WITHIN a State. A SUMLEV of “140” indicates a Census Tract within a County within a State.

Census Summary Levels

Below is a chart showing SUMLEVs for common geographies.

Geographies SUMELV Hierarchy
Census 2000 & 2010
State 040 State
County 050 State-County
County Subdivison 060 State-County-County Subdivision
Tract 140 State-County-Tract
Block Group 150 State-County-Tract-Block Group
Place(aka City) 160 State-Place

Odd Man Out: Census Blocks

Census Blocks have different Summary levels for Census 2000 and Census 2010.

  • For Census 2000, the SUMLEV for Census Blocks is 101. The geographical hierarchy is State-County-County Subdivision-Place/Remainder-Tract-Block Group-Block.
  • For the Census 2010, the SUMLEV for Census Blocks are either 750 with a hierarchy of State-County-VotingDistrict/Remainder-County Subdivision-Place/Remainder-Tract-Block Group-Block OR 755 with a hierarchy of State-County-VotingDistrict/Remainder-County Subdivision-Subminor Civil Division-Tract-Block Group-Block.

Below are the original sources for Summary Level data from the Census Bureau. Use these to look up a geography types and SUMLEVs that aren’t listed above.

Census 2010 Long Form

Photo by Andrew Neel on Unsplash

There is no Census 2010 Long Form.

I still get asked by planners and researchers about when will the Census 2010 Long Form data be released. So I hope to clear up the confusion around this topic. Bottom-line: there is no Census 2010 Long Form. It’s been replaced by the American Community Survey.

Census Short Form versus a Census Long Form

Let’s go back to the Census 2000. The Census 2000 used 2 forms: the Short Form and the Long Form. The Census 2000 Short Form collected basic demographic information from 100% of US residents. The Short Form collected information like population count, sex, age and race. Here’s the Census 2000 Short Form.

The Census 2000 Long Form included all of the Census Short Form questions plus additional, more detailed demographic questions. For example, the Long Form asked about school attendance, languages spoken and disabilities. Here’s the Census 2000 Long Form.

The Census Long Form was sent to only 18 million lucky households–a small sample of the 105.5 million households in the US in 2000. The Census Bureau used the Long Form data collected from the 18 million household sample to then project or estimate the detailed demographic data for the rest of the US households that got the Short Form and weren’t asked the detailed demographic questions.

The Census 2010 Didn’t Use a Long Form

Fastforward to the Census 2010. The decennial Census 2010 only collected basic demographic information (just like the Census 2000 Short Form). The Census Bureau did not include a Long Form Questionnaire in the 2010 Census. Here’s a copy of the 2010 Census Form. You can see that the Census 2010 Form is much more like the Census 2000 Short Form than like the Census 2000 Long Form. In fact, the Census 2010 Form is one of the shortest Census forms in history.

Great, you’re still with me. So since the decennial Census 2010 didn’t use the Long Form, then how are researchers going to get the detailed demographic data like education levels and languages spoken that we need for our planning projects? That’s were the American Community Survey comes in. Just so there’s no confusion, let me quote from the Census Bureau:

Launched in 2005, the American Community Survey (ACS) is part of the decennial census program and is essentially what used to be the long form.

Let me know if you have any other questions about the ACS or Census 2010 in the comments below.

American Community Survey vs. Decennial Census: What’s the Difference

Photo by timothy muza on Unsplash

This post explains the differences between the American Community Survey (ACS) and the Decennial Census and how those differences will impact your work.

Background: Long Form and Short Form

Remember back to the Census 2000 when some people were complaining about the Census form taking forever to fill out? Well, those people received the Census 2000 Long Form which was sent to about 18 million households and collected detailed demographic, economic and housing data. The rest of the US households received the simple Census 2000 Short Form, which was used to count the population and collect basic demographic data. So for the Census 2000, 2 forms were used: the Long Form and the Short Form.

Fast-forward to the Census 2010. The Census 2010 did not use the Long Form, only the Short Form. Enter the ACS. The American Community Survey (ACS) is an annual demographic survey of the United States. It provides the detailed demographic, economic and housing data that was once supplied by the Decennal Census Long Form.

2000 2010
Count + Basic Data Short Form Census 2010
Detailed Data Long Form ACS 5 year estimates

However, the ACS is only sent to 3 million households each year, a statistically small sample especially when compared to the Census 2000 Long Form which was sent to 18 million households in 1 year. So to produce the detailed demographic data, the ACS combines data from several years to produce multi-year estimates. For example, the ACS combines data collected from 2006 + 2007 + 2008 to get 3-year ACS estimates for geographies with at least 20,000 persons. ACS 5 year estimates, which will be out in December 2010, will provide data for geographies with fewer than 20,000 persons.

Similar Data; Different Methodologies & Format

The ACS and the Decennial Census provide the same types of data data–that is, demographic, economic and housing data for the US. However, the methodology of these 2 tools differs greatly.

ACS Decennial Census
What isIt?

Continuous

demographic

survey

Count of the

population

Data

Average

characteristics

OVER TIME

Counts characteristics for a SPECIFIC DATE
How Often

Every 1 year

(more timely)

Every 10 years (less

timely)

House-holds 11 million households over 5 years

18 million households

in 1 year

Sampling Error

Higher Error (1.75

percent

higher than Census

2000*)

Lower Error
Accuracy Less Accurate More Accurate

*[Revised: this information (and much of the blog post) is based on the Census Bureau’s Brian McKenzie’s awesome presentation here]

To sum up the table above, the ACS more timely but less accurate than the Decennial Census, because the data is collected over a series of years (instead of just 1 year), and fewer households are surveyed.

Because the ACS is less accurate, ACS data includes margins or error and is released at 90% confidence limits. Here’s an example of ACS data.

Austin city
Estimate Error Percent Error
Hispanic/Latino 261,672 +/-3,404 35.0 +/-0.4

This means that we can say with 90% confidence that the number of Hispanic persons in Austin is between 258,268 and 265,076 (or 261,672 plus or minus 3,404). We can also say with 90% confidence that the percentage of Hispanic persons in Austin is between 34.6% and 35.4%.

How Does All of this Impact You?

  1. ACS demographic data is less reliable than Decennial Census data. It’s going to be more important than ever use ACS data as a starting point only and to support the data fieldwork, interviews, and data from other sources.
  2. Doing basic calculations with ACS data is going to require an elementary understanding of statistics. For example, calculating percentage change between Census 2000 data and ACS estimates will require basic statistics, because the numbers are not comparable (they are apples to oranges).

If you’re interested, let me know in the comments if a blog post on how to accurately calculate comparisons using Decennial Census data and ACS estimates would be helpful. Or you can check out the Census’ guidance on the topic.  Any questions about the differences between ACS and Decennial Census data? Are there still points of confusion?