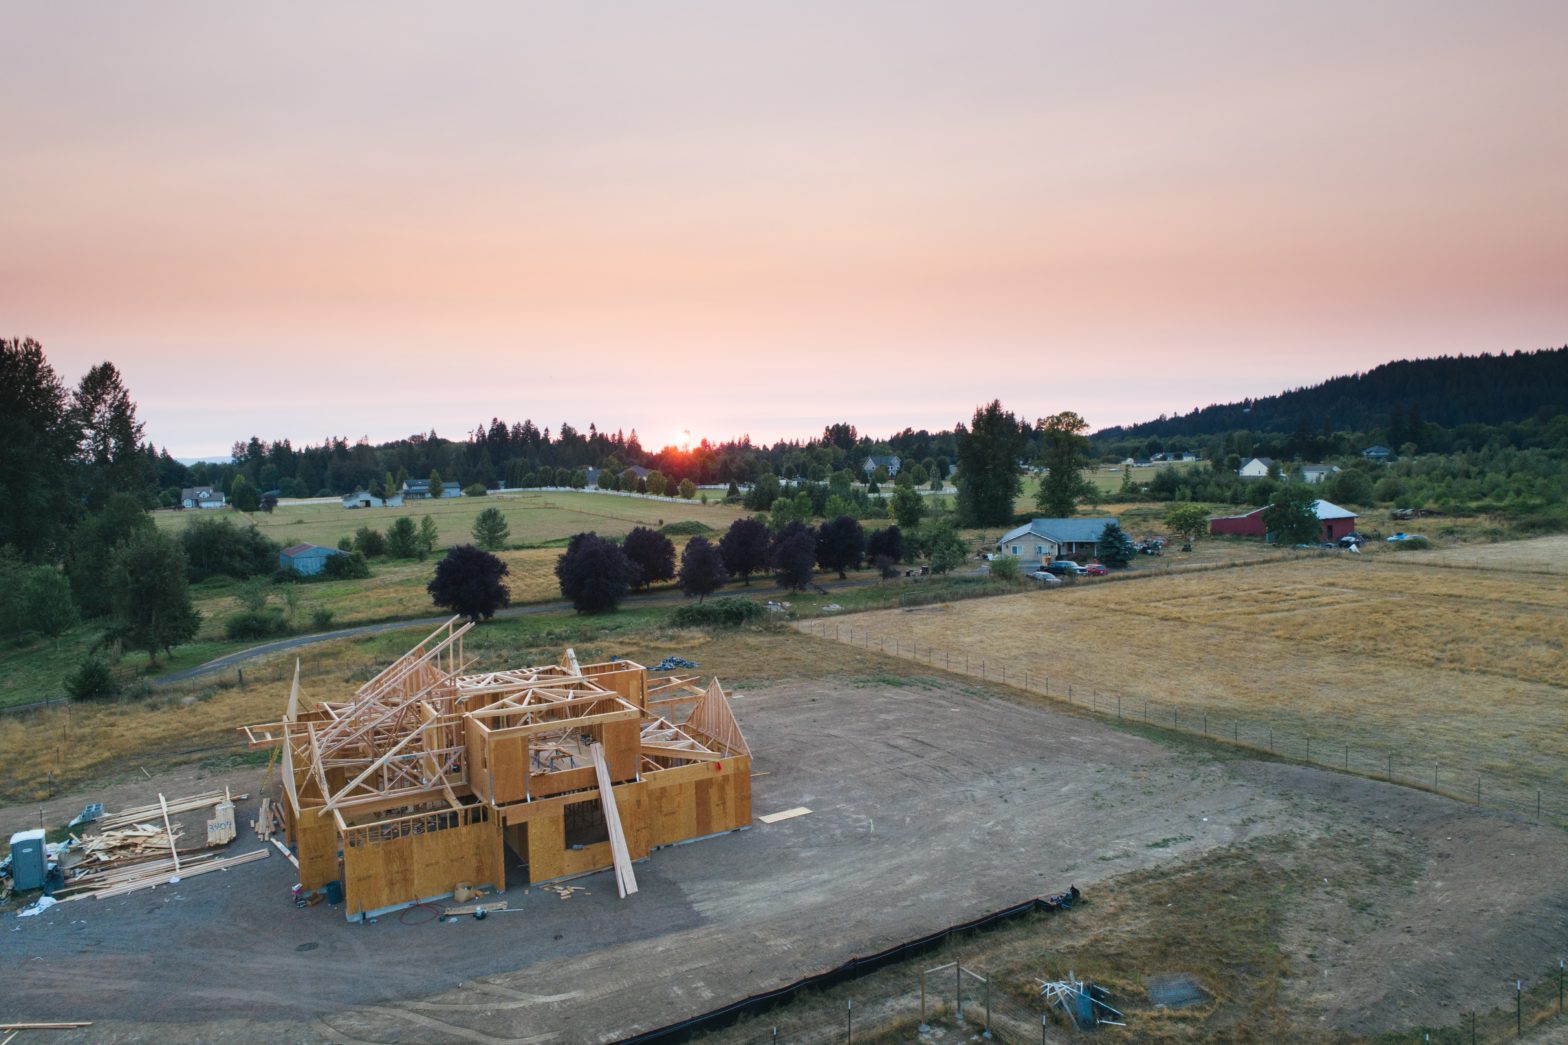
Photo by Avel Chuklanov on Unsplash
People who don’t work with demographic data day in and day out often don’t know that the US Census Bureau collects many other datasets in addition to the Decennial Census that we all have to fill out. The Census’ Building Permit Survey is a lesser known dataset but still a valuable resource. The dataset contains the number of new housing units authorized by building permits, the type of housing (e.g. single family) and unit value.
Data Details: US Census Bureau’s Building Permits Survey
- What: Building Permits
- Who: Small-ish geographies include States, Metropolitan Areas (CBSAs), Counties and individual permit-issuing places (large cities)
- When Updated: Monthly & Annually. Release Schedule.
- Historic data: Yes but it’s complicated. See below for details.
- Join on: FIPS id
What the Building Permit data look like
Possible problems with Building Permit data
The monthly files provide data for all counties that are requested to report monthly (about 900+). So there’s not new data each month for all counties. And there are no data at all for small population cities – which make sense because most of them don’t have that many new buildings going up.
On years that end with 4, the agency updates which places are included in the universe. Below is the reply that I received when asking about guidance for historical comparisons given the universe updates.
“It’s something to be aware of, but doesn’t negate longer run comparisons. Places coming in and out of the universe tend to be smaller and have a minor effect on the data, especially when looking at larger geographies. Most of the change from 2004 to 2014 universe was single family housing in the south, so it’s just something to keep in mind if you see a big jump from 2013 to 2014, just know that universe change could be part of that. For instance smaller places in TX or other larger Southern states that may have not issued permits in 2004, could have begun at some point between 2004 and 2014, so the 2014 data includes them. Odds are good that they weren’t having a significant amount of building and not issuing permits, so permit issuance probably coincided with the increase in building, and therefore less may be omitted than it seems. Just be aware of it if you notice any oddities around universe update years – those ending in 4 – but don’t avoid looking at trends because of it.”
Fun Visualizations
The following visualizations are from the 2018 dataset.Historic Data Availability
While there are historic data available, here’s a table that shows what years data are available for which geographies.

How Building Permit Data are Collected
- “Statistics on construction authorized by building permits are based upon reports submitted by local building permit officials in response to a mail survey. They are obtained using Form C-404,”Report of Building or Zoning Permits Issued and Local Public Construction.” When a report is not received, missing residential data are either (1) obtained from the Survey of Use of Permits (SUP) or (2) imputed. All other missing data are imputed.”
- “The monthly statistics are based on data from a sample of 8,500 permit-issuing places, selected from a universe of approximately 19,000 places.”
- “The annual statistics are not based upon a sample, but are obtained by directly cumulating the data for the 19,000 permit-issuing places.”
More Details
- Methodology Notes: https://www.census.gov/construction/bps/sample/placeasc.pdf
- Geography Notes – Monthly: https://www.census.gov/construction/bps/xls/footnote202002.xls
- Geography Notes – Annual: https://www.census.gov/construction/bps/xls/footnote2018.xls
- Counties and Independent Cities with All Land Areas Covered by Building Permit Systems: https://www.census.gov/construction/bps/pdf/2018completelycoveredcounties.pdf
Other Datasets You Might be Interested in
Don’t Have Time to Pull This Data Yourself?
Whew! Still reading? I’m impressed.
So if you’ve gotten this far and you’re thinking, “Yeah, sure I could pull all of this data myself in a couple of days, but I have other important things to do and I really don’t want to sift through all of the data dictionaries, methodology statements and tool instructions to make sure that I have the most current data for my area of interest,” you are not alone. You sound just like our other clients at Cubit who depend on us to provide clean, accurate and easy-to-work-with data as well as human-to-human customer support. You can get building permit data, as well as hundreds of other data points, in a custom data pull. Prices start at $599 with a 3 business day turnaround. Tell me what data you need for what geography & I’ll get you a free quote & turnaround estimate.
