
I’m starting to get requests for voting statistics as custom data pulls for early analyses for redistricting projects. Below is a roundup of my favorite sources of demographic data for voting-related projects. One note: the resources below don’t cover individual voter records. This list below is for voter data for geographic regions like all voters in a congressional district or in a county. Valuable insights start jumping out when you combine these datasets like combining Election Results data with Voter Age Population Demographics from the Census’ American Community Survey.
Table of Contents
| Name | Source | Price | Geographies |
| Registered Voters & Election Results | State, County & City websites | Free | 1 state, 1 county, 1 city |
| Voter Age Population Demographics | Census’s American Community Survey | Free | All US Geographies – large & small |
| Registered Voters | Census’s Current Population Survey | Free | States & MSAs |
| Election Results | Dave Leip’s Atlas of US Presidential Elections | $ | All US Counties & CDs |
| U.S Citizen Voting Age Demographics | Social Explorer | $ | Some large & small US geographies |
| Custom Data Pull | Cubit | $ | All US geographies – large & small |
- Registered Voters & Election Results for Single Geographic Areas
- Price: Free
- Geographies: 1 State, 1 county or 1 city
If you need state-level voting statistics, below is a collection of state agencies with registered voter and election results data. Because we’re often pulling voter demographics, I included notes about any demographic data that we’ve found for voters on the states’ websites in the Types of Data section in the table below.
| Name | Types of Data |
| Alabama Secretary of State / Elections Data | Voter Registration Statistics by Race; Election Results by Race, Age & Gender |
| Alaska Division of Elections / Statistics | Registration by Party & Age; Voter Turnout by Age, Gender & Party; Election Results |
| Arizona Secretary of State / Voter Registration | Voter Registration Statistics by Party; Election Results |
| Arkansas Secretary of State / Elections / Research | Registered Voters; Election Results |
| California Secretary of State / Election / Voter Information | Voter Registration Statistics by Age Range and Political Bodies; Qualified Political Parties |
| Colorado Secretary of State / Voter Registration | Voter Registration by Status, Party, Gender, Age |
| Connecticut Secretary of the State / Election / Voter Information | Elections Results and Turnout Statistics; Voter Registration Statistics |
| District of Columbia / Board of Elections | Voter Registration Statistics Monthly Report |
| State of Delaware / Department of Elections / Office of the State Election Commissioner | Registered Voter Totals by Month; Election Results |
| Florida Division of Elections / Data & Statistics | Election Data / Results; Voter Registration Statistics; Monthly Reports; Voter Turnout |
| Georgia Secretary of State / Elections | Active Voters by Race and Gender; Election Results; Turnout by Demographics; Candidate Information |
| State of Hawaii Office of Elections | Election Results; Registered Voters; Voter Turnout |
| Idaho Secretary of State’s Office / Elections Office | Voter Registration |
| Illinois State Board of Elections | Election Information / Results; Voting Information; Election Results / Vote Totals |
| Indiana Secretary of State / Election Division | Election Results; Voter Registration and Turnout Statistics |
| Iowa Secretary of State / Elections / Research and Data | Election Results and Statistics; Voter Registration |
| Kansas Secretary of State / Elections | Election Statistics / Results; Candidate Lists |
| Commonwealth of Kentucky / State Board of Elections | Election Results; Registration Statistics; Primary Voter Turnout by Age, Gender, Party |
| Louisiana Secretary of State / Elections & Voting | Registration Statistics by Race; Graphical Election Results |
| Maine Department of the Secretary of State / Bureau of Corporations, Elections & Commissions | Election Results; Registered & Enrolled Voters |
| Maryland The State Board of Elections | Voter Registration Statistics by Month; Active Voters; Election Results; Official Turnout by Party; Candidate Lists |
| Secretary of the Commonwealth Massachusetts / Election/ Voting / Elections Division | Election Results; Registered Voter Enrollment; Voter Turnout Statistics; Candidate Lists; |
| Michigan Office of Secretary of State / Elections | Candidate Listings and Election Results; Registered Voter Count |
| Minnesota Secretary of State / Election Administration & Campaigns / Data & Maps | Election Results; Voter Registration; Voter Turnout by Age Group |
| Mississippi Secretary of State / Online Voter Information Center | Election Results |
| Missouri Secretary of State / Elections & Voting | Registered Voters; Election Results; Voter Turn Out |
| Montana Secretary of State / Election & Voter Services | Official Election Results; Voter Registration; Official Turnout Results |
| Nebraska Secretary of State / Elections | Number of Registered Voters by Party; Election Official Results |
| Nevada Secretary of State / Elections | Voter Registration by Age & Party; Voter Registration; Election Turnout |
| New Hampshire Secretary of State / Elections Division | State Election Results; Party Registration/Names on Checklist History |
| New Jersey Division of Elections / Election Information & Results | Summary of Registered Voters and Ballot Cast; Election Results; Voter Registration |
| New Mexico Secretary of State / Voting & Elections | Election Results; Voter Registration Statistics / Data |
| New York State Board of Elections | Election Results; Voter Enrollment by Party Affiliation and Status |
| North Carolina State Board of Elections | Election Results; Voter Registration Statistics by Party by Race by Sex |
| North Dakota Secretary of State / Elections | Election Results; Statistics & Turnout from Past Elections |
| Ohio Secretary of State / Elections and Voting | Election Results; Voter Turnout |
| Oklahoma State Election Board | Voter Registration; Election Results |
| Oregon Secretary of State / Voting & Elections | Voter Registration by Year / Month; Elections Historical Turnout; Statewide Election Results |
| Pennsylvania Department of State / Voting & Elections | Voter Registration Statistics; Election Results |
| Rhode Island Secretary of State / Voter Information State of Rhode Island Board of Elections | Registered Voters; History of Voter Turnout; Voter Turnout by Generation; Election Results |
| South Carolina Election Commission / Results & Statistics | Voter Registration; Election Results |
| South Dakota Secretary of State / Elections & Voting | Election Results; Voter Registration Totals by Party |
| Tennessee Secretary of State / Elections | Voter Registration; Voter Turnout; Election Results |
| Texas Secretary of State / Elections | Turnout and Voter Registration; Election Results |
| Utah Lieutenant Governor / Elections | Voters by Party and Status; Election Results |
| Vermont Secretary of State / Elections | Voter Registration Totals; Election Results; Voter Registration, Turnout, and Absentee Voter Statistics |
| Virginia Department of Elections / Results / Reports | Registrant Counts; Election Results; Registration/Turnout Statistics |
| Washington Secretary of State / Elections / Research | Election Results; Registered Voters by Age; Registered Votes by Gender; Registered Voters by Age Group |
| West Virginia Secretary of State / Elections Division | Election Results / Turnout; Candidate Listing by Office; Voter Turnout Data; Voter Registration Totals |
| Wisconsin Election Commission / Elections | Election Results; Voter Registration Statistics; Voter Turnout Statistics |
| Wyoming Secretary of State / Elections | Voter Registration Statistics; Voter Turnout Statistics; Election Results |
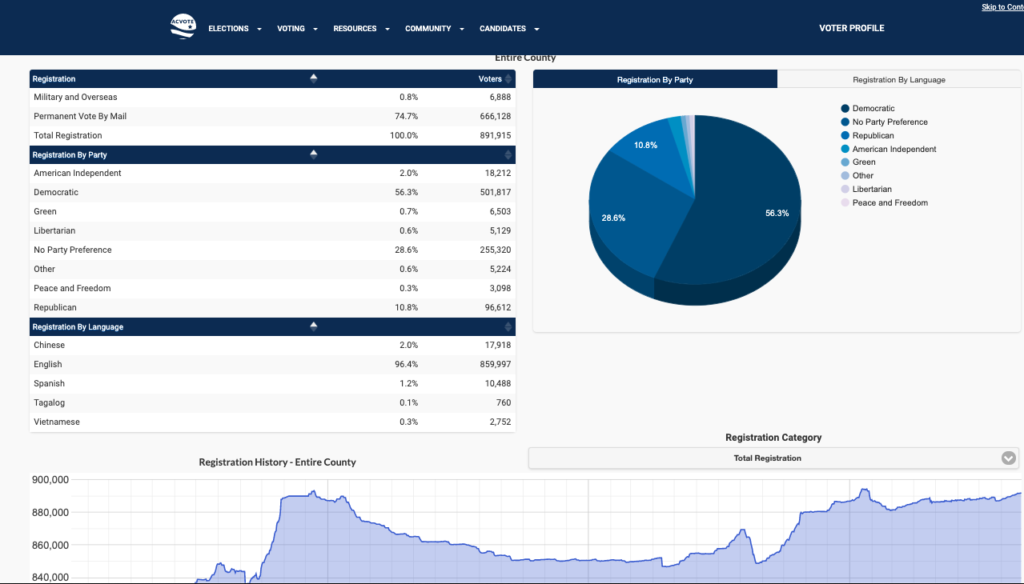
If you need voting stats for small geographic areas like counties or cities, many counties make voter statistics available on their website. For example, the following breakdown by Party and Language that’s on Alameda County’s website.
2. Voter Age Population Demographics: Census’ American Community Survey
- Price: Free
- Geographies: All US Geographies from large like states & counties to small like zips, Census tracts, & block groups
While you can’t get registered voter counts from the Census’ American Community Survey, this dataset has the most current demographics for the voting age population. The most current US Census data is 2017 data, and the 2018 data will be released in December 2019. While you can get American Community Survey demographics for large geographies like congressional districts, you can also get this data for small geographies like zip codes and Census tracts (4,000ish people). These small geographies are particularly helpful if you want to visualize the makeup of a larger geography. You can download this data from census.gov and get the following popular demographics.
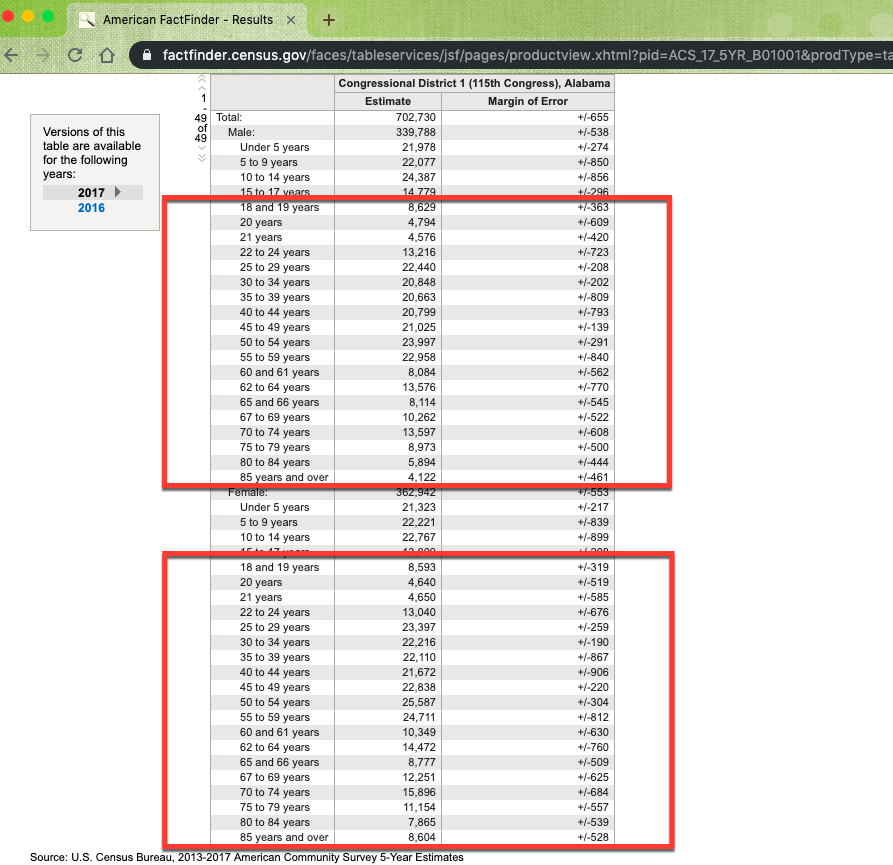
Age, Sex, Race/Ethnicity
- Example: voting age population by age and sex
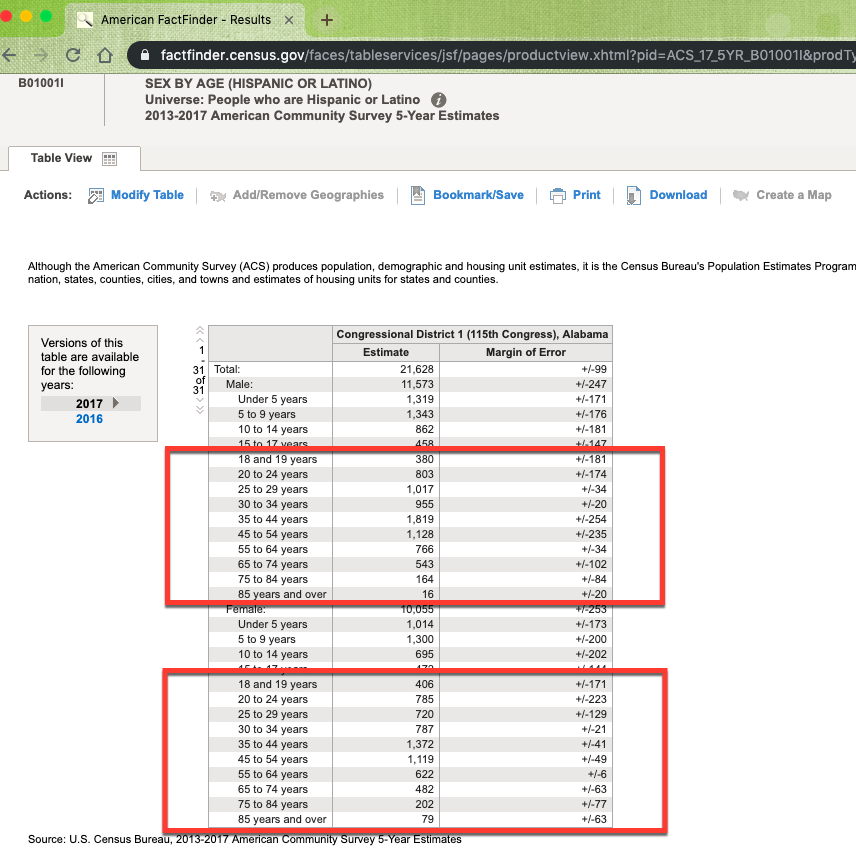
- Example: voting age population by age, sex and race/ethnicity. In this example, we are displaying Hispanic or Latino but other races & ethnicities are available as well.
Income
Voting age population by income is tricky, because the income categories are for households (not individuals), and because the Census publishes data for householders under 25 (which kind of makes sense if you think about how few 18 years olds are working jobs but under 25 years doesn’t align nicely to voting ages). But you can get income data by age of householder for the following age breakdowns:
- Householder under 25 years
- Householder 25 to 44 years
- Householder 45 to 64 years
- Householder 65 years and over
You can get the above data income data by age of householders by race/ethnicity, but I would suggest only getting this data for large geographies like counties because the margins of error will be too large for the small geographies. Below is a sample of income by age of householder data for a county for the first 2 age brackets. You can also get median income rather than a distribution here.

There are thousands and thousands of other data points that can be pulled from the American Community Survey (see 2017 ACS Detailed Table Shells), but the ones listed above (age, sex, race/ethnicity and income) are the most popular for voting demographic projects that we’ve done in the past.
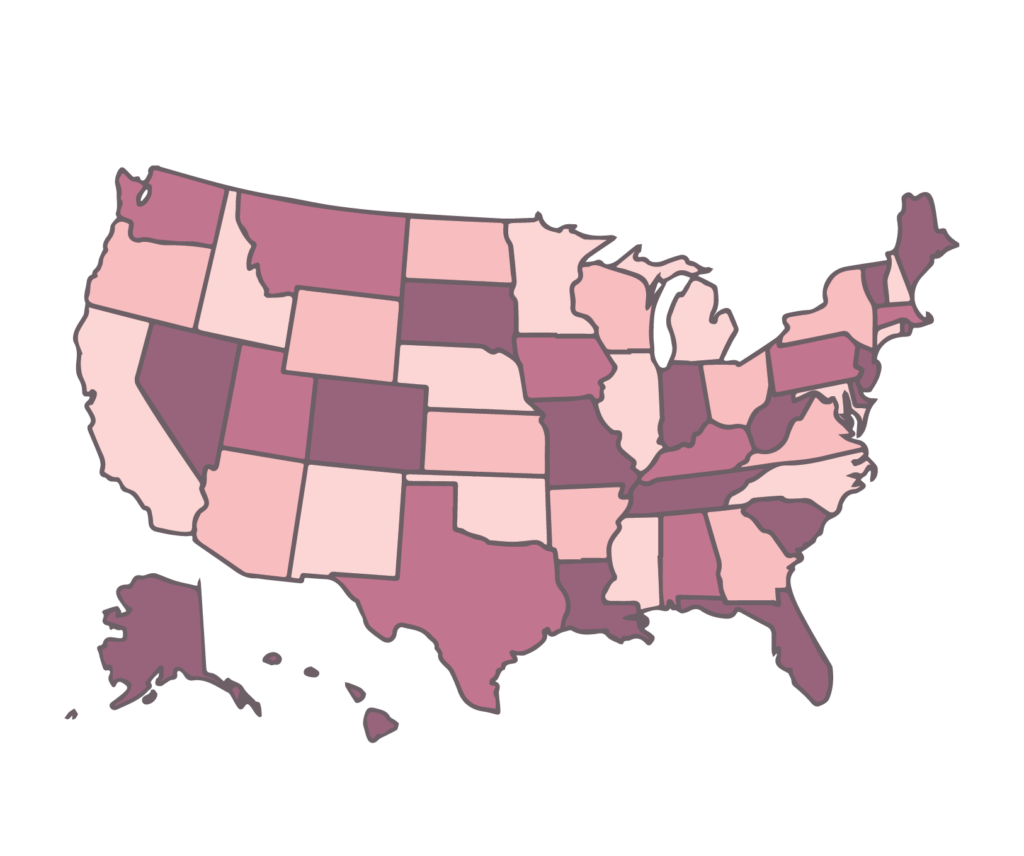
When you overlay the above Census tract demographics on top of voting precinct boundaries in a map, you can identify areas with low voter registration. Sometimes, Census tracts and voting precincts line up, so that you can easily compare the Census’ population estimates with the number of registered voters of a precinct. But even when the voting precincts don’t perfectly align with Census tract, we can help you calculate the percent overlap for precincts and Census tracts to estimate the demographics for the precincts. In the map of Miami-Dade County Voting Precincts and Census tracts below, you can see examples of when Census tracts and precinct align and examples of when the boundaries don’t align.
3. Registered Voters: Census’ Current Population Survey
- Price: Free
- Geographies: states and metropolitan statistical areas
You can get registered voter data from the US Census using their Current Population Survey dataset. I like to use the Current Population Survey for the total population for cities, counties and states, but you can also use this dataset to get registered voter data for large geographies like metropolitan statistical areas and states. This dataset is the most technically challenging dataset to work with in this list, and here’s what you need to do.
- For the raw microdata, go here: https://thedataweb.rm.census.gov/ftp/cps_ftp.html?#
- click on CPS Supplement
- On the top rows, you will see the Technical Documentation and the microdata files (DOS/Windows preferred).
- After downloading, to read in the ascii file, you’ll have to write your own program, using the Record Layout given in the Tech Doc.
- An alternative to writing your own program. The NBER site does not have the Nov 2018 file, but does have the Nov 2016. You may be able to use the data definition statement file for Nov 2016, as there were no changes to the variables or locations. Certain values, however, did change. To obtain this data definition statement file, go here: https://data.nber.org/data/cps_progs.html then scroll down to Nov 2016 Voting and Registration. Select the software of your choice (SAS, SPSS, Stata). Download the file. This will convert the ascii file to a SAS/SPSS/Stata file.
- Variables you will definitely need to work with are: GESTFIPS, GTCBSA, PRTAGE, PRPERTYP, PRCITSHP, PES1, PES2.
- Be sure to read these parts of the Tech Doc: Attachments 1, 3, 6, 7, 8.
- Main universe for the supplement: PRTAGE = 18+ and PRCITSHP = 1,2,3,4.
- Condition for being registered to vote: PES1 = 1 OR PES2 = 1.
4. Election Results (and County Registration & Turnout data): US Election Atlas
- Price: Depends on the dataset, but I tend to spend at least $200
- Geographies: All Counties & Congressional Districts in the US
For election results for the entire US, I tend to purchase the 2016 President by County dataset from Dave Leip’s Atlas of US Presidential Elections. Below are some images showing results by state, but county results tend to be more popular. The last time we worked with the Governor Election dataset, there were many states that didn’t have governor election data at the county level.
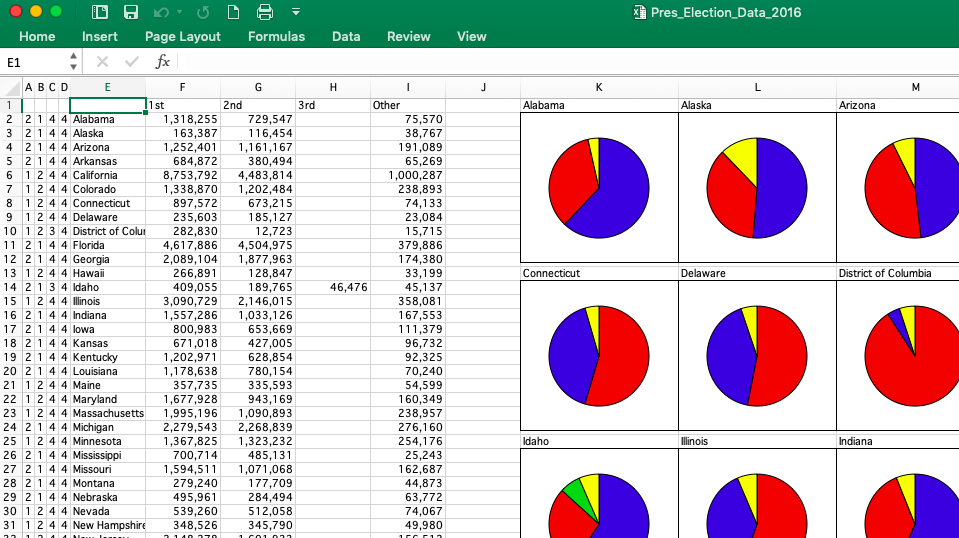
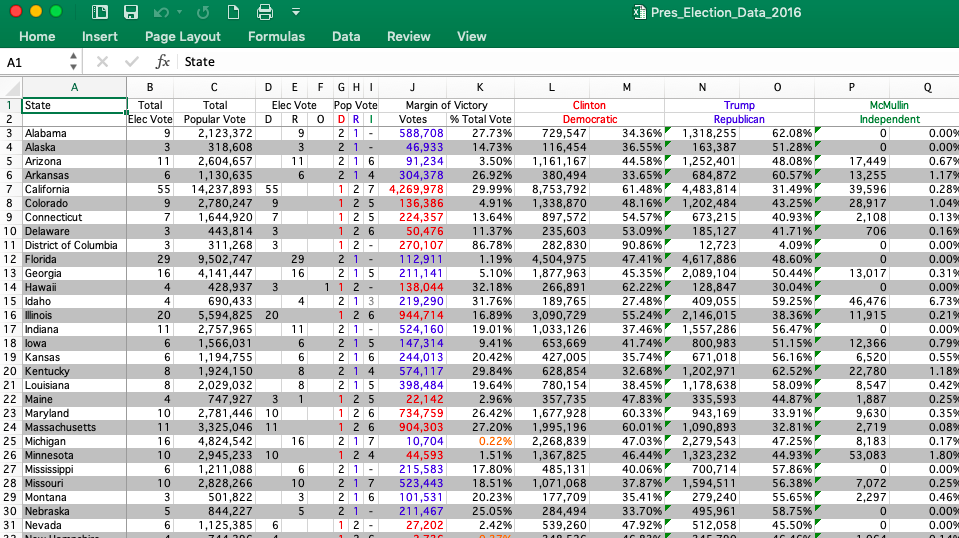
There’s also voter registration and turnout data by county for the entire US – which sounds interesting, but I haven’t had a chance to work with this data yet. I would like to though. Just waiting for the right project.

5. U.S. Citizen Voting Age Demographics by Age: Social Explorer
- Price: Free trial, then $100 a month for individuals
- Geographies: states, counties, cities, census tracts, block groups, congressional districts, state legislative districts
Social Explorer is a web application that lets you pull and map certain datasets. I don’t use Social Explorer often, because we have in-house tools and mapping software that are more flexible. BUT they do have a Citizen Voting Age Population Special Tabulation based on the most current US Census’ American Community Survey. You can get data on:
- Race
- Citizens by Race
- Citizenship status
- Total Seats in the state
- District Size Deviation based on different bases
- Citizen of Voting Age
If you need some of the more popular demographics like voting age population by race or by age and you don’t already know how to pull this data from census.gov, you could sign up for a free trial of Social Explorer to see if it’s the right tool for your project.

6. Custom Data Pull | Cubit
- Price: Starts at $599
- Geographies: All US Geographies from large geographics like states & counties to small geographies like zips, Census tracts, & block
Whew! Still reading? I’m impressed.
So if you’ve gotten this far and you’re thinking, “Yeah, sure I could pull all of this data myself in a couple of days, but I have other important things to do and I really don’t want to sift through all of the data dictionaries, methodology statements and tool instructions to make sure that I have the most current data for my area of interest,” you are not alone. You sound just like our other clients at Cubit who depend on us to provide clean, accurate and easy-to-work-with data as well as human-to-human customer support. You can get voting data, as well as hundreds of other data points, in a custom data pull. Prices start at $599 with a 3 business day turnaround. Tell me what data you need for what geography & I’ll get you a free quote & turnaround estimate.
Don’t see the voting stats that you are looking for in the post above? Contact me. I have a couple of other sources that either aren’t as popular or change with too much frequency for me to include in this roundup.
Conversely, do you have a favorite voter statistics resource that isn’t on my list? Please let me know so I can share it with others.