
Photo by Chris Lawton on Unsplash
Once in a blue moon, I get a custom data request to use the most current US Census data to produce estimates for Nielsen’s designated market areas or DMAs.
If you can buy data from Nielsen, you should, because they are the only definitive source for DMAs. That said, I’ve tried to purchase data from Nielsen multiple times and they’ve never called or emailed me back. So if you can’t get Nielsen to call you back, you can use the following process.
Nielsen defines “a DMA region is a group of counties that form an exclusive geographic area in which the home market television stations hold a dominance of total hours viewed.”
Given that DMAs are groups of counties and the US Census Bureau publishes estimates for counties, then all you have to do is:
- Identify the counties that make up the DMA;
- Pull the most current Census demographics for those counties; &
- Sum up the estimates.
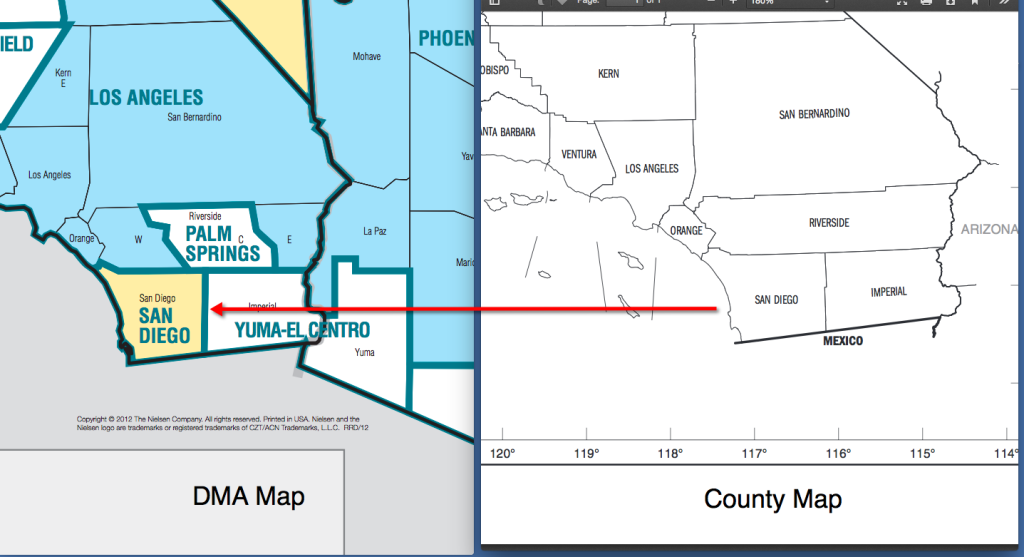
Easy peasey, right? There are 12 DMAs that split counties. See the map below for 2 examples of DMAs that split counties.
List of DMAs that Split Counties
| Oneida County | Utica |
| Syracuse | |
| Lea County | Odessa-Midland |
| Albuquerque-Santa Fe | |
| Apache County | Phoenix |
| Albuquerque-Santa Fe | |
| Kern County | Bakersfield |
| Los Angeles | |
| Riverside County | Los Angeles |
| Palm Springs | |
| Solano County | San Francisco- Oakland – San Jose |
| Sacramento – Stockton – Modesto | |
| El Dorado County | Reno |
| Sacramento – Stockton – Modesto |
So if you don’t need data for these problem DMAs, you can google search for a mapping of DMAs to counties (like this one). Then you can pull the most current Census data from census.gov (or we sell the most popular demographic data points for all US counties for $199 as an instant download here) and then use a handy SUMIF function in Excel to produce your estimates.
But if you need demographics for all DMAs or at least 1 DMA that splits counties, here’s how you can handle these problem geographies.
1. Produce a shapefile with DMA Boundaries
For the 199 DMAs that play nice with county boundaries
A. Start with these boundaries: https://github.com/simzou/nielsen-dma
B. Fix Rochester, MN and Rochester, NY (which are swapped) and created boundaries for Anchorage, AK, Juneau, AK, Fairbanks, AK and Honolulu, HI (which were missing).
C. Doublecheck your work using Nielsen documentation and make any needed corrections.
The 11 DMAs that split counties
- In the file that you’ve created above, swap the boundaries for these 11 DMAs listed in this blog post above with the boundaries in the 2008 shapefile provided by Harvard here.
- Doublecheck your work using Nielsen documentation and make any needed corrections.
2. Intersections with Census geographies.
Now that you have a DMA spatial file that you are happy with, run intersections with Census geographies.
- For the 199 DMAs that play nice with counties, produce a county to DMA list.
- For the 11 DMAs that split counties, run intersections between the DMA and Census tracts and calculate the area percent overlap. Census tracts generally have a population size between 1,200 and 8,000 people, with an optimum size of 4,000 people.
3. Estimating Demographics
- For the 199 DMAs that play nice with counties, sum the county estimates.
- For the 11 DMAs that split counties, multiply the Census tract estimates by the percent overlap. If 10% of the area of a Census tract is in the Reno DMA, then assign 10% of the population in that Census tract to the Reno DMA. Thoughts: there are more accurate ways to solve this, but this one works pretty well for the level of effort involved.
- You can use this formula for median calculations like median income or median age.
4. QA
- Compared your results to Nielsen’s data. For example, New York, Los Angeles, & Chicago are the DMAs with the largest populations. Are your 3 largest DMAs also New York, Los Angeles & Chicago?
- Consider calculating a percent difference between Nielsen’s Metro age 12+ population for 2019 and the Census Bureau’s 2018 age 10+ population. This percent difference would show you if any of your estimates are off.
Want to geek out more about Census demographics or DMAs or anything else data related?
Either fill out the Custom Data Request form or call me, Kristen, at 1-800-939-2130.