Population Growth by State 2020
Planning Data
Kristen Carney

On Monday, April 26, 2021, the Census Bureau released the Census 2020 population by state data, also known as apportionment data. These counts are used to divide up the seats in the U.S. House of Representatives among the 50 states. We can use this first Census 2020 data release to calculate population growth by state for 2020.
My partner, Anthony, built the data viz below so you can see how your state(s) of interest grew. The idea behind this visualization is that you can tell at a glance that “this state is growing [faster than | about the same as | slower than] the US or other states as well as itself.”
Population Growth by State 2020 Data Visualization
| 2020 Residential Population | Percent Population Change | |||
|---|---|---|---|---|
| 1990-2000 | 2000-2010 | 2010-2020 | ||
| United States | 331,449,281 | |||
| Alabama | 5,024,279 | |||
| Alaska | 733,391 | |||
| Arizona | 7,151,502 | |||
| Arkansas | 3,011,524 | |||
| California | 39,538,223 | |||
| Colorado | 5,773,714 | |||
| Connecticut | 3,605,944 | |||
| Delaware | 989,948 | |||
| District of Columbia | 689,545 | |||
| Florida | 21,538,187 | |||
| Georgia | 10,711,908 | |||
| Hawaii | 1,455,271 | |||
| Idaho | 1,839,106 | |||
| Illinois | 12,812,508 | |||
| Indiana | 6,785,528 | |||
| Iowa | 3,190,369 | |||
| Kansas | 2,937,880 | |||
| Kentucky | 4,505,836 | |||
| Louisiana | 4,657,757 | |||
| Maine | 1,362,359 | |||
| Maryland | 6,177,224 | |||
| Massachusetts | 7,029,917 | |||
| Michigan | 10,077,331 | |||
| Minnesota | 5,706,494 | |||
| Mississippi | 2,961,279 | |||
| Missouri | 6,154,913 | |||
| Montana | 1,084,225 | |||
| Nebraska | 1,961,504 | |||
| Nevada | 3,104,614 | |||
| New Hampshire | 1,377,529 | |||
| New Jersey | 9,288,994 | |||
| New Mexico | 2,117,522 | |||
| New York | 20,201,249 | |||
| North Carolina | 10,439,388 | |||
| North Dakota | 779,094 | |||
| Ohio | 11,799,448 | |||
| Oklahoma | 3,959,353 | |||
| Oregon | 4,237,256 | |||
| Pennsylvania | 13,002,700 | |||
| Puerto Rico | 3,285,874 | |||
| Rhode Island | 1,097,379 | |||
| South Carolina | 5,118,425 | |||
| South Dakota | 886,667 | |||
| Tennessee | 6,910,840 | |||
| Texas | 29,145,505 | |||
| Utah | 3,271,616 | |||
| Vermont | 643,077 | |||
| Virginia | 8,631,393 | |||
| Washington | 7,705,281 | |||
| West Virginia | 1,793,716 | |||
| Wisconsin | 5,893,718 | |||
| Wyoming | 576,851 | |||
Sources for the above visualization
- 1990 All Geographies Except Puerto Rico - https://www.census.gov/data/tables/1990/dec/1990-apportionment-data.html
- 1990 Puerto Rico - https://www2.census.gov/programs-surveys/popest/tables/1990-2000/municipios/totals/pr-99-1.txt
- 2000 - https://www.census.gov/data/tables/2000/dec/2000-apportionment-data.html
- 2010 - https://www.census.gov/data/tables/2010/dec/2010-apportionment-data.html
- 2020 - https://www.census.gov/data/tables/2020/dec/2020-apportionment-data.html
You can get the same visualization above when you purchase Radius Reports for counties. Using the population projection data in the report, you can say “this county, where I’m interested in opening my new business, is growing [faster than | about the same as | slower than] the state.”
Where's the rest of the Census 2020 data?
It's coming. I still haven’t heard a release date for the Demographic and Housing Characteristics File (aka the good stuff that we all want --- data for small geographies). I will be updating the 2020 Census Data Release Update blog post as I hear more.
Other Highlights from the Census Bureau's 2020 Apportionment Data Release
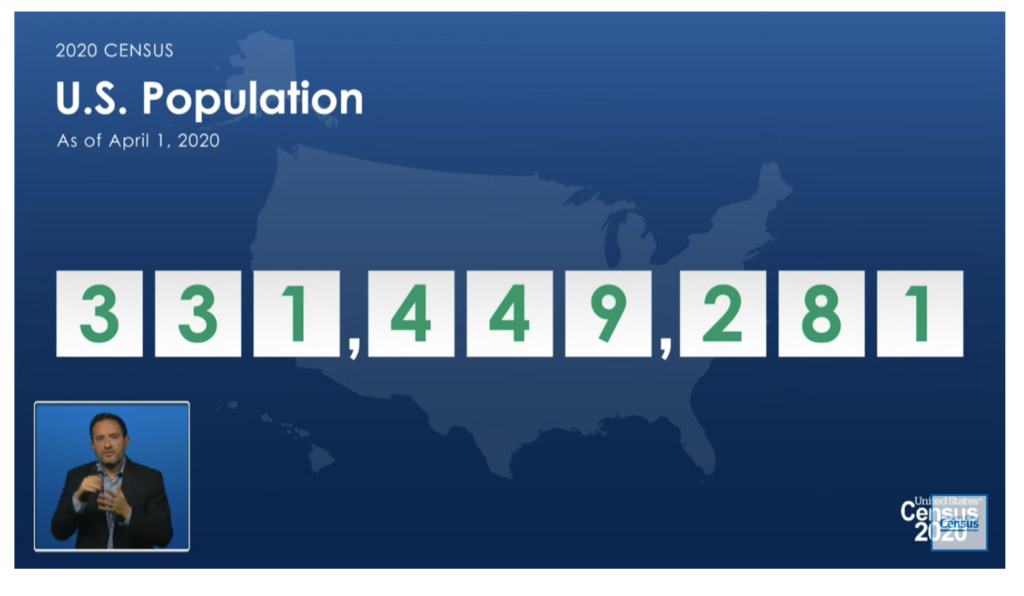
Yesterday, the Census Bureau released apportionment data which includes the total U.S. Population. As of April 1, 2020, we were 331,449,281 people strong.
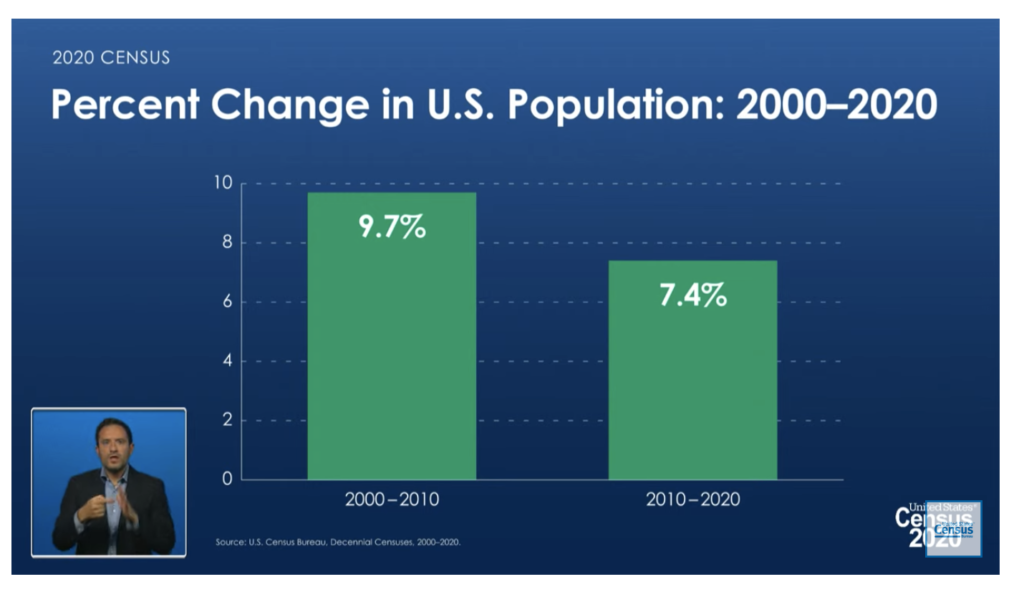
As a country, our population is increasing, but the growth rate slowed a bit over the past 10 years. As you can see below, the percent change dropped from 9.7% in 2000 – 2010 to 7.4% in 2010 – 2020. In fact, the Census Bureau staff mentioned that this is one of the slowest population growth periods we’ve had in our nation's comparatively short history.
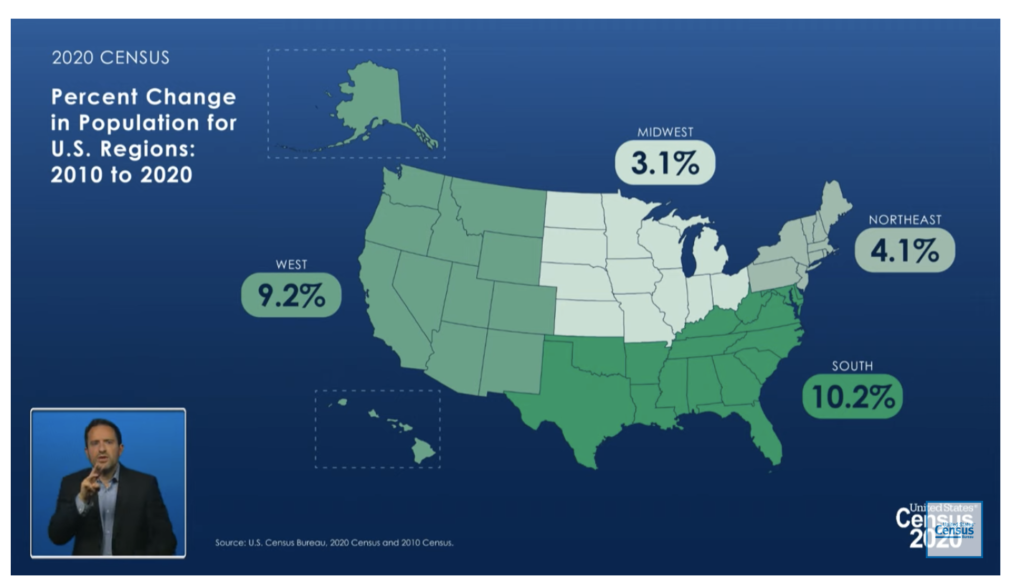
The South and West regions are growing faster than the other regions. Must be all of that sunshine and warmth!
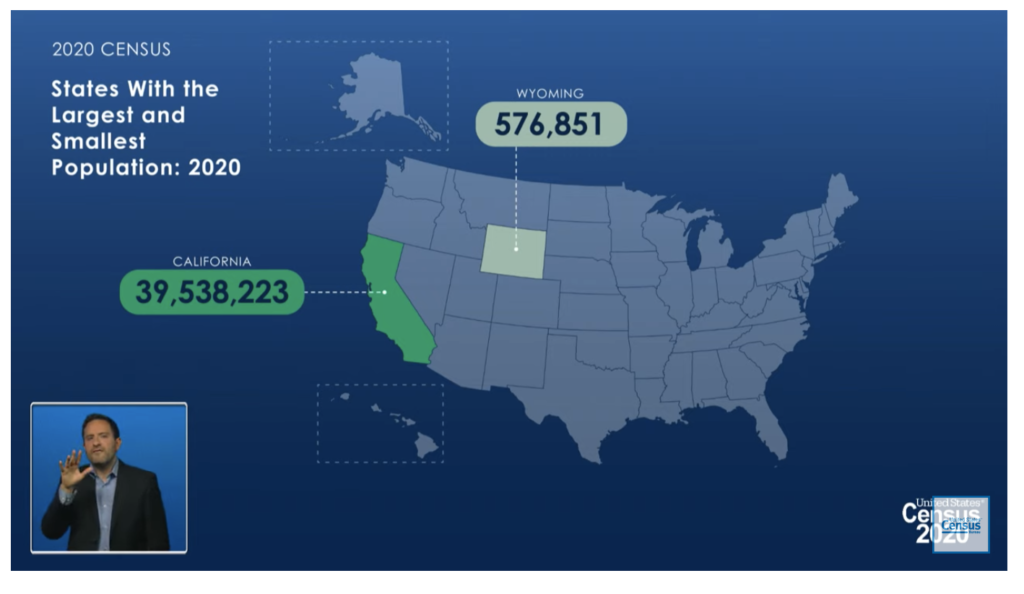
California and Wyoming are not that different if you are looking at land area but look at the huge difference in the population.
Most states grew in population during the 2010 – 2020 time period with Utah being the fastest growing state. Only 3 states had a decrease in population with West Virginia declining the most.
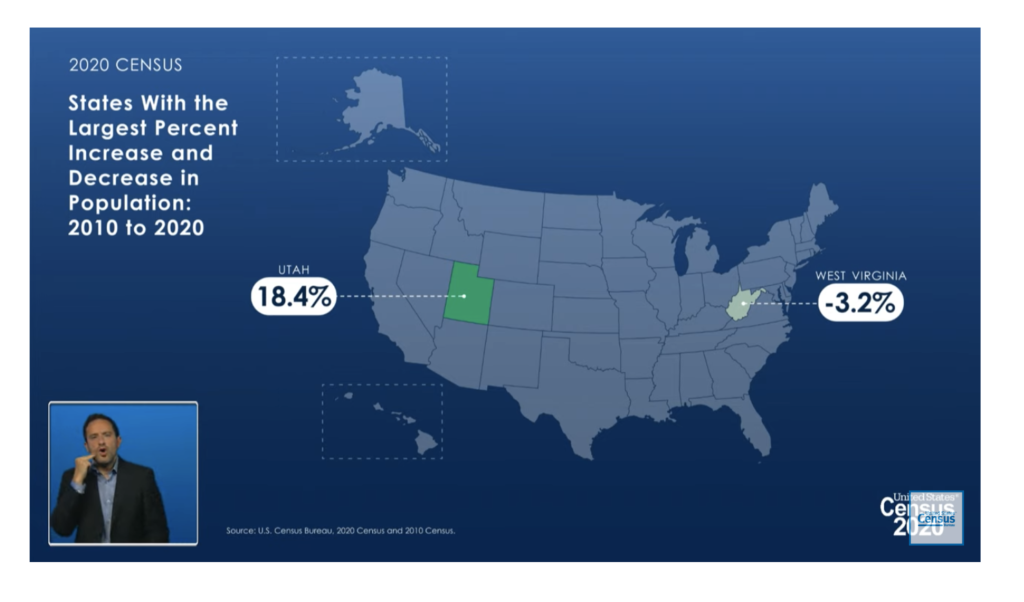
The above images are from the US Census Bureau's Apportionment News Conference.